
What a crossover row represents
The scan can include moving-average, price-versus-average and trend-model events. These are not interchangeable: a Supertrend flip is not an EMA 20/50 cross. Read the event label before comparing candidates.
| Field | Meaning | Common misread |
|---|---|---|
| Age / freshness | Bars since the selected event | A late event is not a new cross |
| Separation | Distance between the model reference series | Large separation can also mean extension |
| RVOL | Volume relative to its baseline | High volume does not specify the direction |
| Setup grade | A ranking of the selected conditions | A grade is not a win rate |
Use the crossover workspace
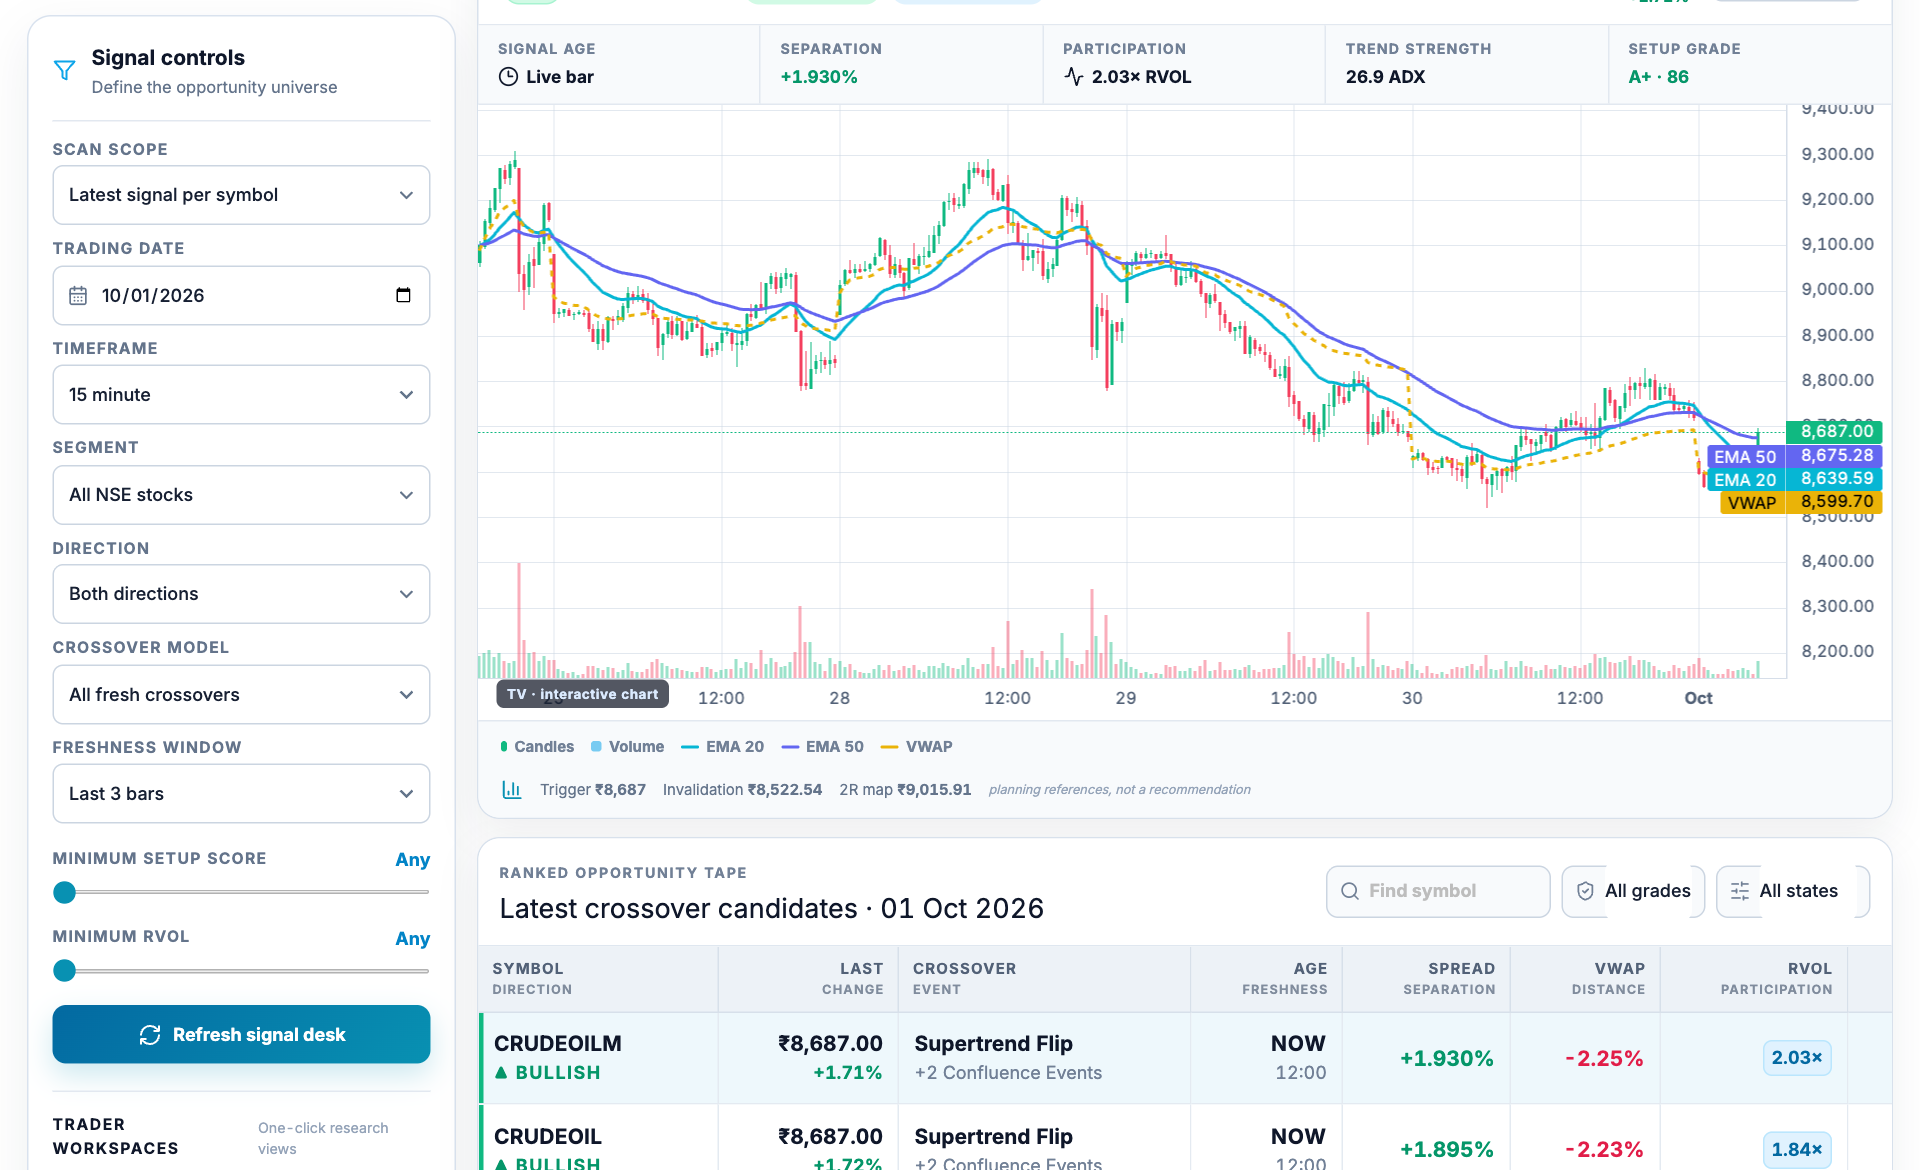
- Choose the scan scope. Latest signal per symbol is different from all historical events.
- Set freshness. Last three bars limits the age of an event rather than changing its formula.
- Read participation and grade. RVOL and the setup grade describe different attributes.
- Verify the event on the chart. Match the labeled model with the candle interval and event timestamp.
- Set trading date, timeframe, segment and direction.
- Choose the crossover model and freshness window.
- Select a row and inspect its chart; read the EMA, VWAP or other model labels.
- Compare separation and RVOL with the signal age.
- Review later candles to see whether the relationship persisted or crossed back.
Read a hypothetical EMA cross
Suppose EMA 20 moves above EMA 50 at the close of a 15-minute candle. Two bars later, the fast average is still above, separation is 0.2% and RVOL is 1.4×. This is a two-bar-old bullish cross under that model; it does not establish an entry price, a guaranteed trend or a 1.4× expected return.
Where crossovers mislead
- Sideways markets can generate repeated crosses in both directions.
- A fast timeframe reacts sooner but also changes more often.
- A developing candle can change the apparent cross before the close.
- A historic event may remain in a list after price has moved far from it.