
Pivot point and central pivot range
The standard pivot point is PP = (previous high + previous low + previous close) ÷ 3. The central pivot range uses BC = (high + low) ÷ 2 and TC = 2 × PP − BC, with the upper and lower boundaries ordered by price. A pivot is a calculated reference, not an order waiting in the market.
| Field | Read it as |
|---|---|
| Price zone | Where the current observation sits relative to reference levels |
| Vs PP % | Percentage distance from the central pivot |
| R1 / S1 | Calculated first resistance and support references |
| CPR width % | Width of the central range relative to the chosen basis |
Use the pivot scan
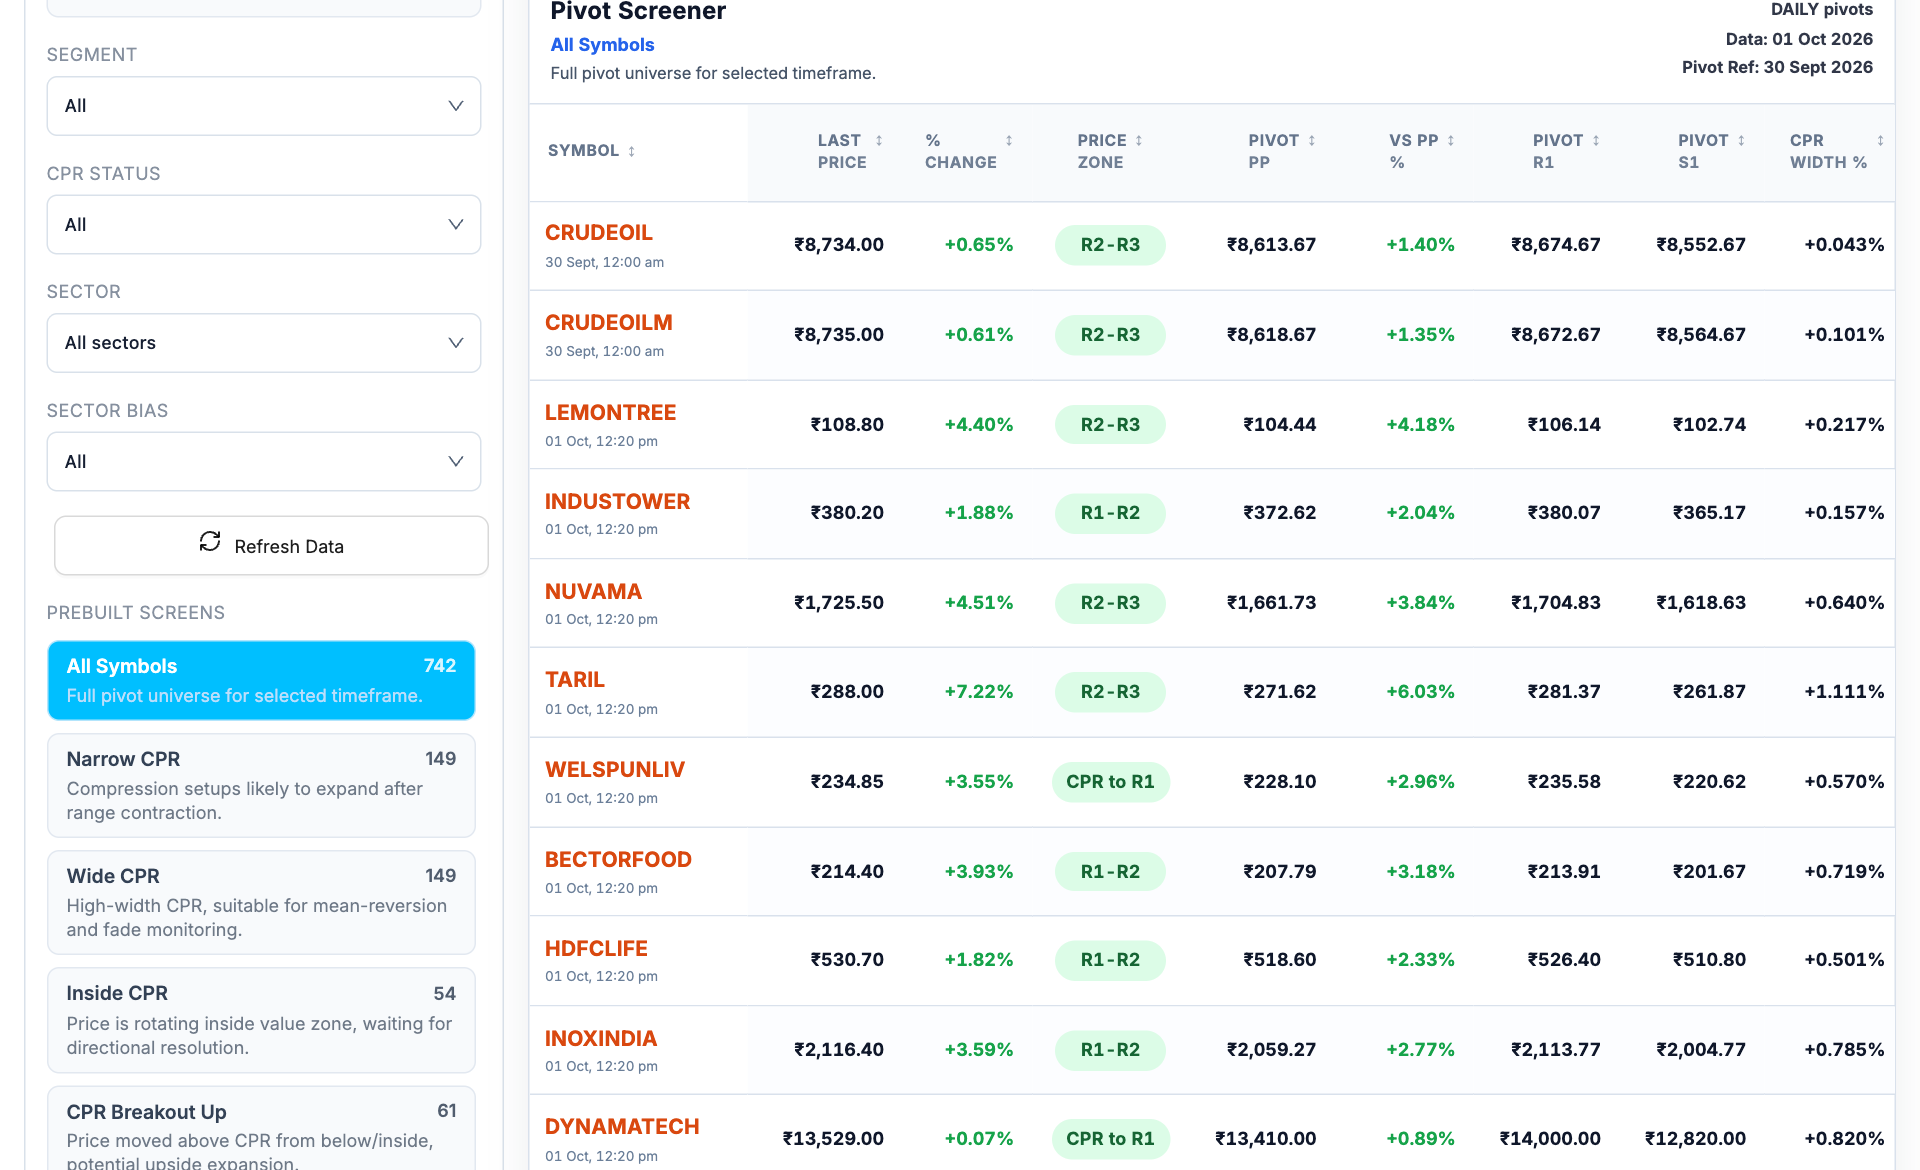
- Choose CPR status. Narrow, wide and inside CPR conditions answer different questions.
- Match the reference date. Data date and Pivot Ref identify the observation and the period used to build levels.
- Read the price zone. A zone describes location between levels; it is not a forecast.
- Check CPR width. A narrow width describes the reference range, not certain expansion.
- Choose pivot timeframe, segment and session.
- Confirm the displayed data and pivot reference dates.
- Select a narrow/wide CPR or breakout preset, keeping the same reference period.
- Compare price zone, distance from PP and the actual level prices.
- Open the symbol chart to check price behavior near those references.
A simple calculation
For a prior high of 110, low of 100 and close of 108, PP is 106.00, BC is 105.00 and TC is 107.00. A current price of 106.50 lies inside this CPR. That location does not predict whether price exits upward or downward.
Avoid mixing periods
- Daily and weekly pivots use different reference candles.
- Incomplete or missing OHLC inputs can distort the reference.
- A narrow CPR is a compression descriptor, not a calibrated breakout probability.
- Price can cross a reference repeatedly in a range.