
Two directions through the surface
Across a fixed expiry, IV can vary with moneyness: that is the smile or skew. Across maturities at comparable moneyness, IV forms a term structure. Comparing a far-out-of-the-money put in one expiry with an ATM call in another mixes both dimensions.
The heatmap bins contracts by the displayed moneyness convention. Read that definition and the snapshot before comparing cells. Colors are relative to the legend and should not be treated as a buy or sell instruction.
Screenshot: expiry and moneyness together
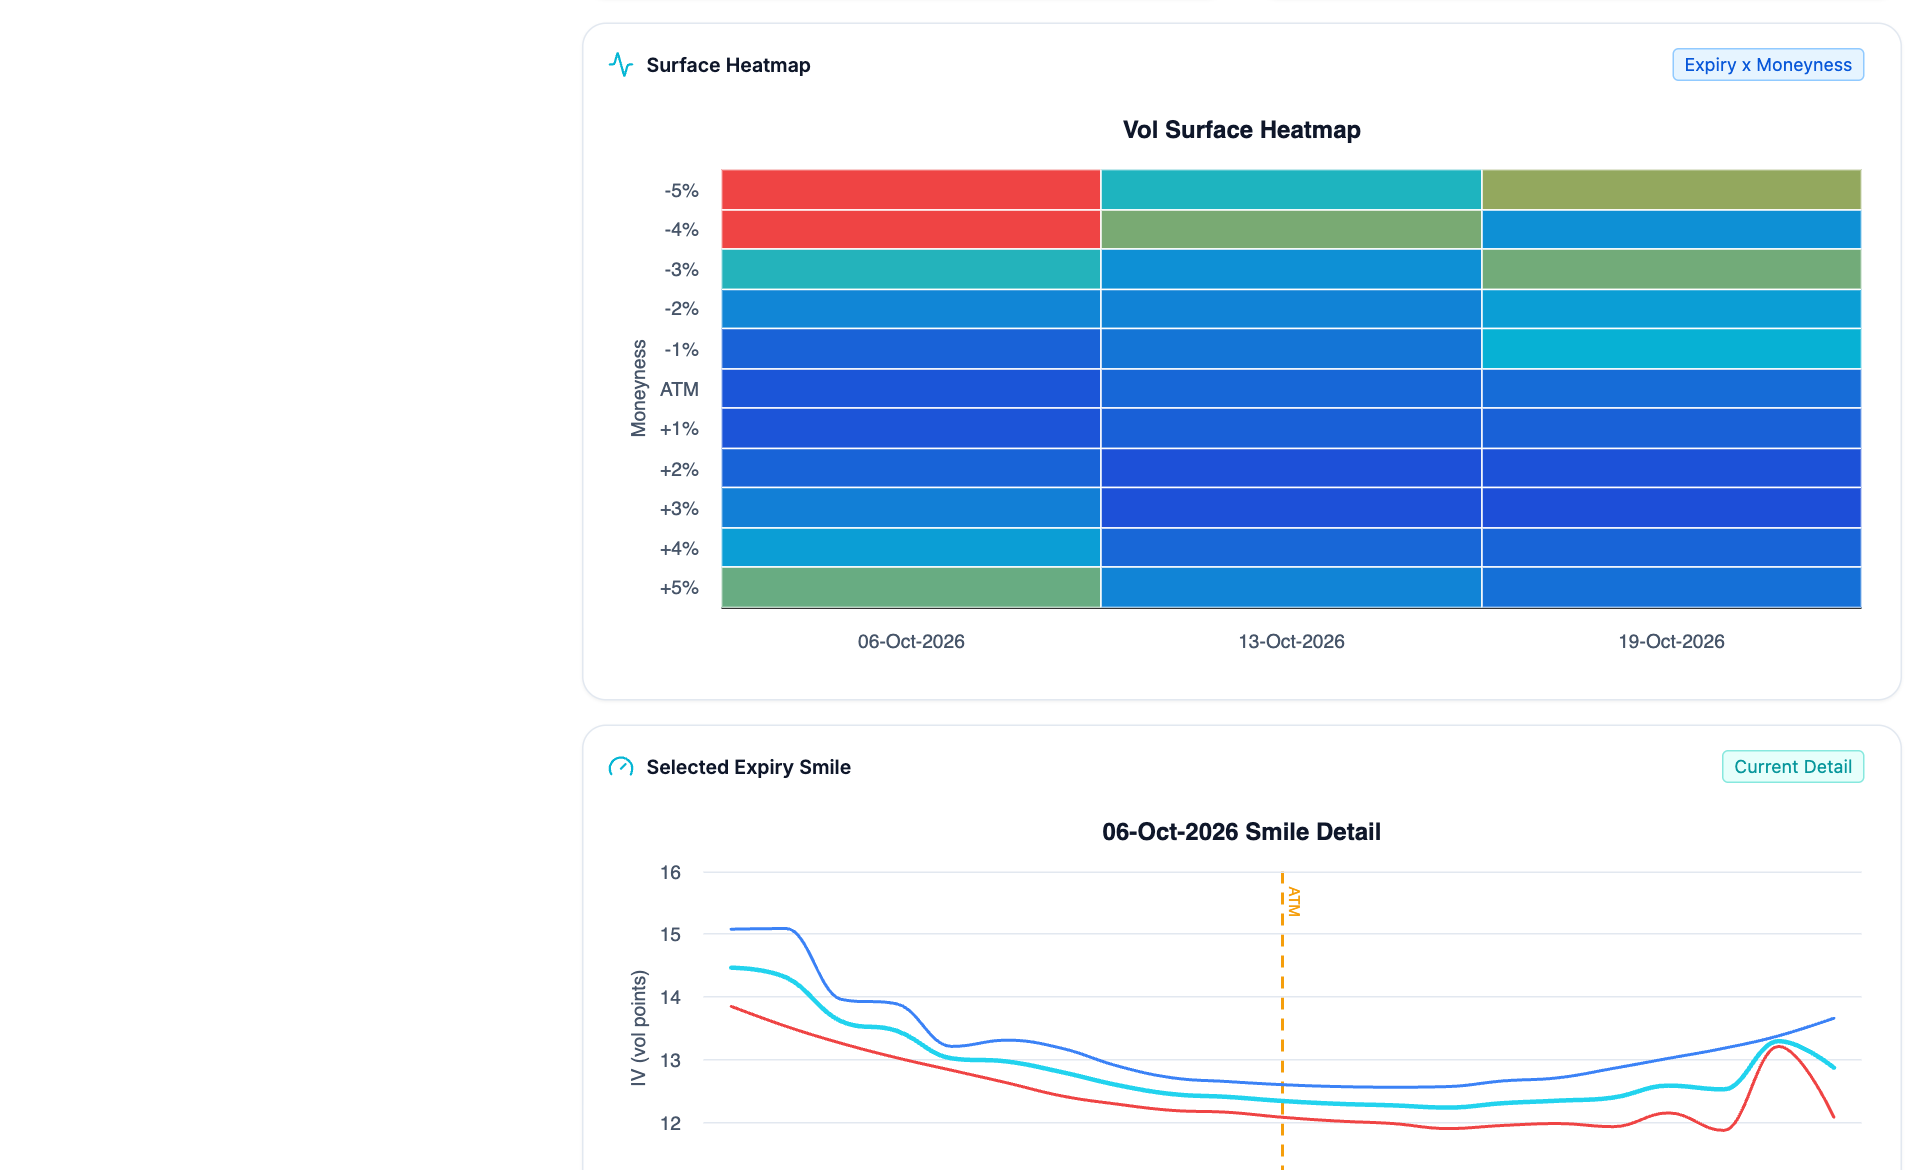
- Moneyness axis. Read each row relative to ATM using the application’s moneyness convention.
- Expiry columns. Compare one row across expiries to investigate term structure.
- Neighboring cells. An isolated cell deserves a quote-quality and event check before an economic explanation.
- Selected smile. This lower panel expands one expiry. Its ATM marker and IV units define the comparison.
Investigate a surface difference
- Choose the instrument, observation date and available expiry scope. Check the snapshot time.
- Read the heatmap along one row to compare maturities at similar moneyness.
- Read one column to compare wings with ATM within the same maturity.
- Inspect the selected-expiry smile for the contracts behind a heatmap feature. Verify call and put labels and any reference line.
- Check prices, spreads, volume and scheduled events before interpreting an isolated kink. Use the IV chart and chain for contract detail.
Worked example: an event concentrated in one expiry
Suppose ATM IV is 24% in the nearest expiry and 18% in the next. The near contract prices higher annualized volatility, but the observation does not establish an arbitrage. Different event exposure, time to expiry, liquidity and carrying assumptions can justify the difference.
A smooth surface does not prove fair value
Stale contracts, interpolation and sparse wings can produce misleading smoothness or artificial kinks. An anomaly is a reason to investigate. Trading it requires a position definition, executable quotes and assumptions about how the surface will evolve.