
Volatility points versus relative percent
A shock from IV 20% to 22% is +2 volatility points. It is a 10% relative increase, not a +2% relative move. Read the shock labels before interpreting the ladder. Reversing the shock can reverse the modeled vanna contribution, while changes in other modeled terms can make total responses nonlinear.
Net flow combines signed contributions; gross flow measures their magnitude without relying on cancellation. A small net total can coexist with substantial offsetting strike exposure. These are model diagnostics rather than published trade-side flows.
Screenshot: the scenario matrix and response
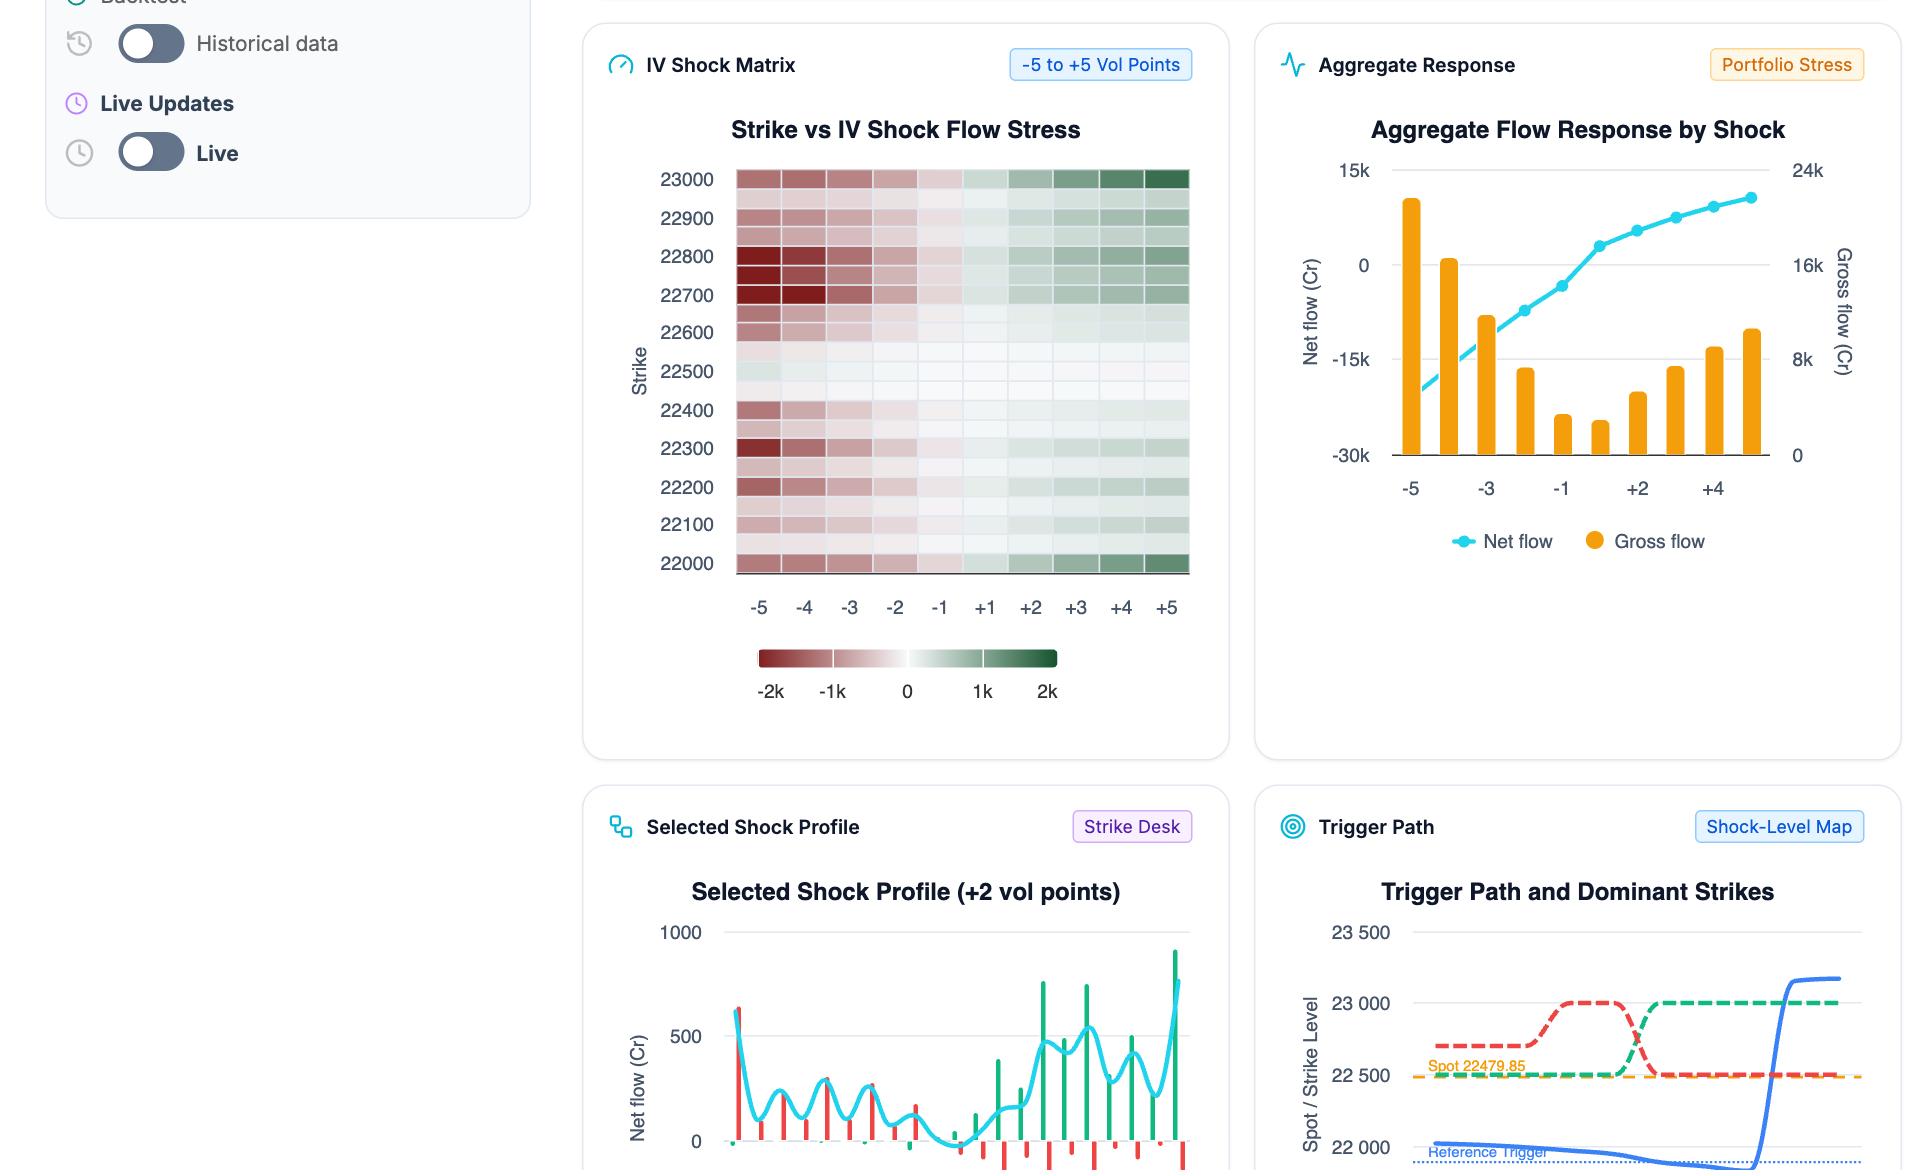
- Strike versus shock. Rows identify strikes and columns identify assumed volatility-point shocks.
- Net versus gross. Read the two series and their axes independently; cancellation can lower net flow.
- Selected shock. The supporting profile describes one chosen shock rather than the whole ladder.
- Trigger displacement. The scenario can move a modeled crossing and dominant strikes. These are conditional levels.
Compare two volatility scenarios
- Choose instrument, session, expiry setup and strike coverage. Check the snapshot time and any positioning assumptions.
- Start with a small positive volatility-point shock, then inspect the same-magnitude negative shock.
- Use the matrix to see whether stress is concentrated at a few strikes or spread through the covered chain.
- Compare net and gross response before the selected shock profile. A modest net change can conceal large offsetting contributions.
- Read the trigger path as a conditional output under the selected assumptions. Use the volatility-trigger guide to understand the zero-gamma crossing.
Worked example: netting can hide exposure
Two illustrative strike contributions of +100 crore and −90 crore produce +10 crore net flow and 190 crore gross magnitude. The small net result does not mean each strike is unimportant. Check where the offsetting contributions sit relative to spot.
What a shock model cannot establish
IV can move differently across strikes and expiries. A parallel shock simplifies that surface change; actual responses also depend on spot, time, liquidity and the model’s signs. Scenario flow is not a known future order, trading probability or executable P&L.