
Realized movement is different from option IV
ATR and Bollinger bandwidth are calculated from observed prices. Option implied volatility is inferred from option prices. A low ATR percentile therefore does not establish that an option is cheap.
| State | Meaning |
|---|---|
| Compression watch | Price remains inside a statistically quiet base |
| Near boundary | Price is near a recent base boundary |
| Expansion confirmed | The configured boundary, participation and close-location conditions are met |
| Weak confirmation | A boundary was crossed without all confirmation conditions |
| Low context | Freshness or liquidity conditions are insufficient |
Use the map and research table
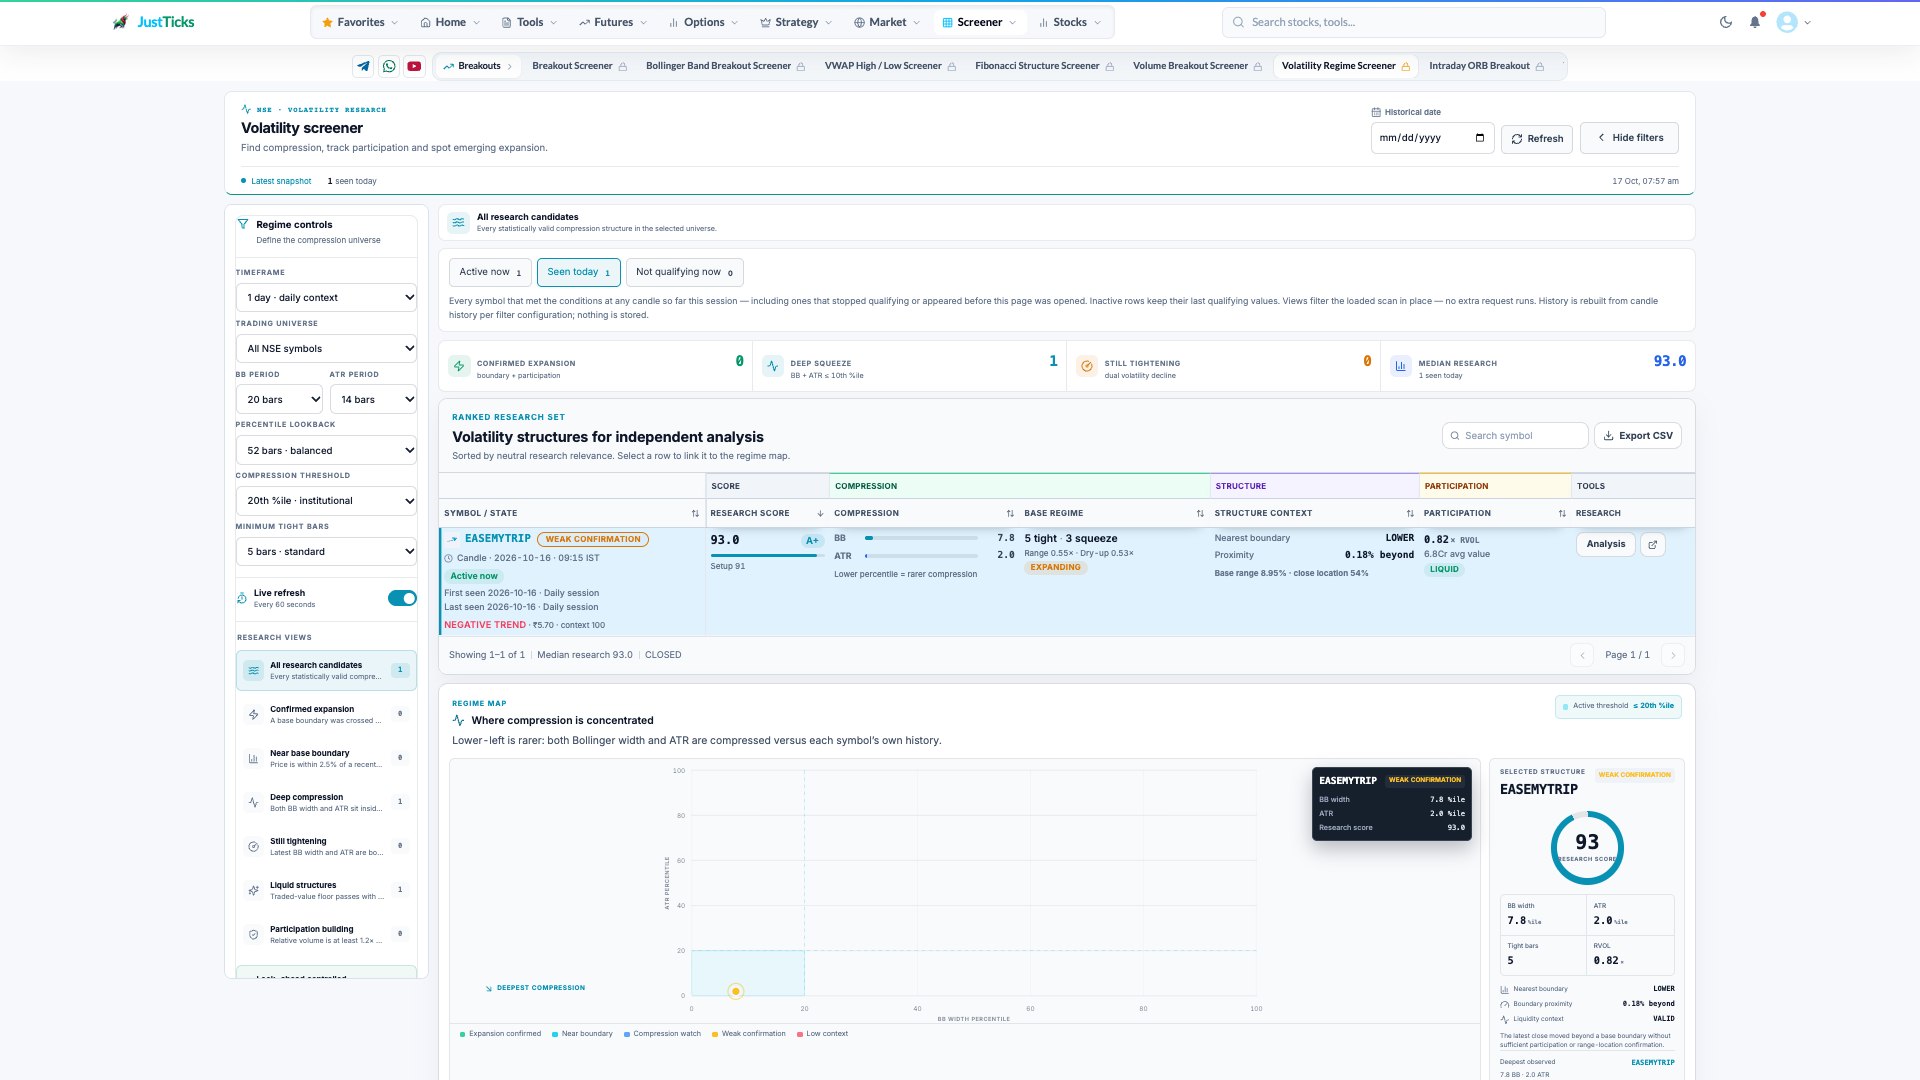
- Timeframe. Compression is measured within the selected interval and universe.
- BB and ATR periods. These settings change the volatility measures used for the comparison.
- Historical threshold. The percentile threshold is relative to the selected history.
- State and research score. Compression quality and a directional confirmation are separate questions.
- Open Volatility Screener, select universe, timeframe and observation date.
- Choose All Research Candidates, Deep Compression or another specific state.
- Compare BB-width percentile and ATR percentile in the regime map. Lower-left means both measures are low relative to their own histories.
- Select a row and inspect its source-candle time, boundary distance and participation.
- Review a historical date with the same settings. A retained seen-today row can display its last qualifying observation rather than current price.
Percentiles measure rarity within a reference sample
BB width at the 8th percentile and ATR at the 6th percentile mean both readings are low compared with that symbol's historical distribution. They do not mean an 8% or 6% price move. A second symbol at the same percentiles can have a very different absolute trading range.
Keep compression separate from direction
- No fixed countdown connects a low percentile with the next breakout.
- Percentiles depend on the history sample and timeframe.
- The research score orders context rather than predicting an outcome probability.
- Daily candle timestamps do not certify a completed session.
- Historical research replay is not a strategy backtest with costs and fills.