
What qualifies as a failed auction
The reference range is built from prior candles in the selected lookback, excluding the newest candle. A downside excursion followed by a close back above the prior low is a bullish reclaim under the model. An upside excursion followed by a close below the prior high is a bearish rejection.
| Field | Interpretation |
|---|---|
| Wick ratio | How much of the candle is rejection wick |
| Excursion | How far price traveled beyond the reference boundary |
| Volume ratio | Participation relative to a recent baseline |
| Re-entry depth | How far the close returned inside the range |
| Flow proxy | An OHLCV estimate; not actual aggressor-side volume |
Inspect a reclaim or rejection
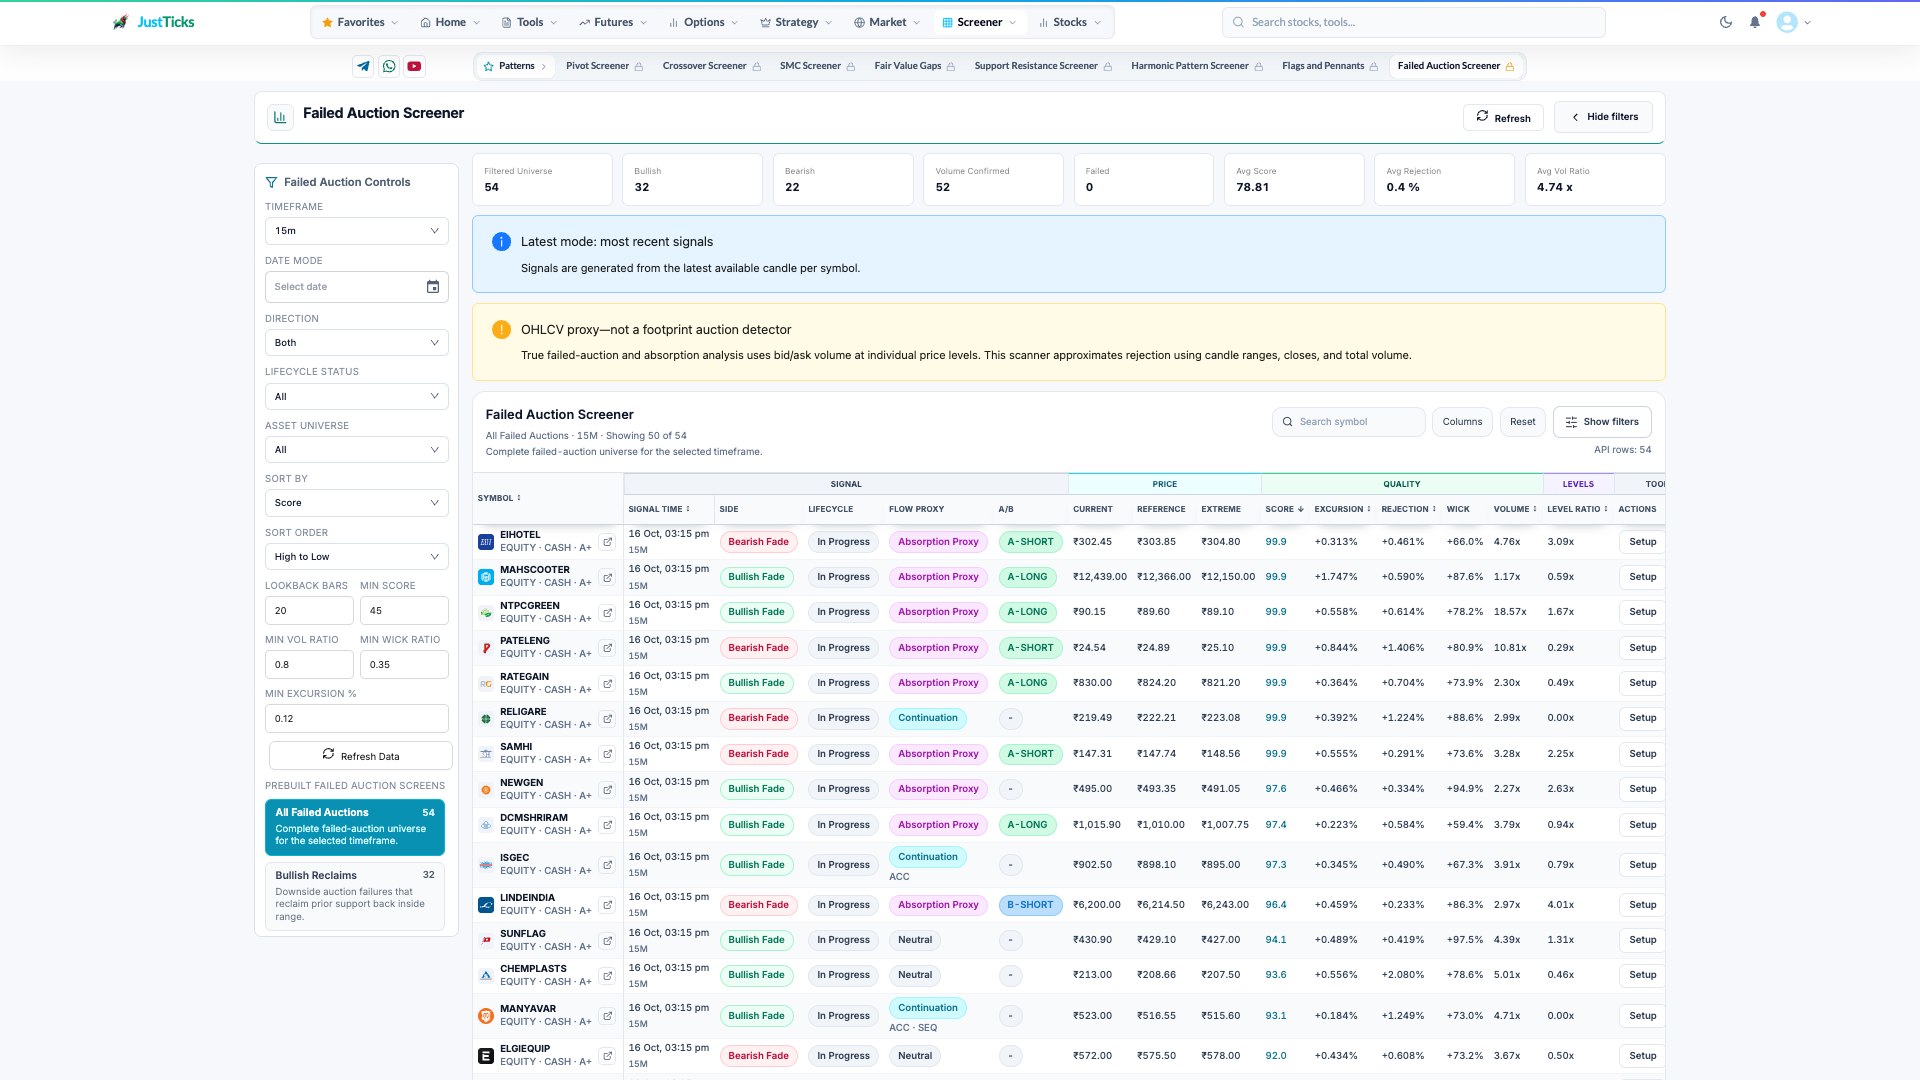
- Observation interval. Use the selected timeframe when reviewing rejection and candle structure.
- Lifecycle. Distinguish an in-progress setup from one that has already reached a level.
- OHLCV proxy. The tool explicitly approximates rejection from candles and total volume; it is not a bid/ask footprint.
- Signal details. Read lifecycle, proxy, reference and extreme together rather than treating the side label as proof of flow.
- Open Failed Auction Screener, choose date, timeframe and universe.
- Set the lookback and direction, then start with Bullish Reclaims or Bearish Rejections.
- Read the reference boundary, excursion, wick ratio and close location on the chart.
- Compare volume and the current lifecycle instead of treating every historical rejection as active.
- Review the failed extreme, range midpoint and opposite boundary as model references, checking how much price has already moved.
A rejected break is a specific observation
Suppose the prior 20-candle range is 100 to 110. The newest candle trades to 111.5 but closes at 109.5. That is an upside excursion with a return inside the range. If later candles hold above 110, the original rejection has lost its initial context; the first candle did not prove lasting seller control.
Flow labels remain estimates
- Estimated CVD and absorption proxies are calculated from OHLCV; they do not reveal each trade aggressor or institutional intent.
- A developing candle can close outside after temporarily returning inside.
- A sparse or illiquid candle can produce a large wick without broad participation.
- A score ranks observed conditions; it does not establish the probability of a successful fade.