
What the Camarilla levels represent
The reference levels are based on a previous period's high, low and close. R3/S3 form nearer reversal references and R4/S4 form outer break references under this model. The reference period is part of the calculation; daily and weekly levels must not be compared as if they were identical.
| Lane | Question |
|---|---|
| Breakout Watch | Is price above or approaching R4? |
| Breakdown Watch | Is price below or approaching S4? |
| Up / Down Reversals | How did price interact with S3/S4 or R3/R4? |
| Level Progress | Where is price along the calculated T1–T5 ladder? |
| EMA × VWAP | Does the selected moving-average relation agree with current momentum? |
Use the Camarilla scan
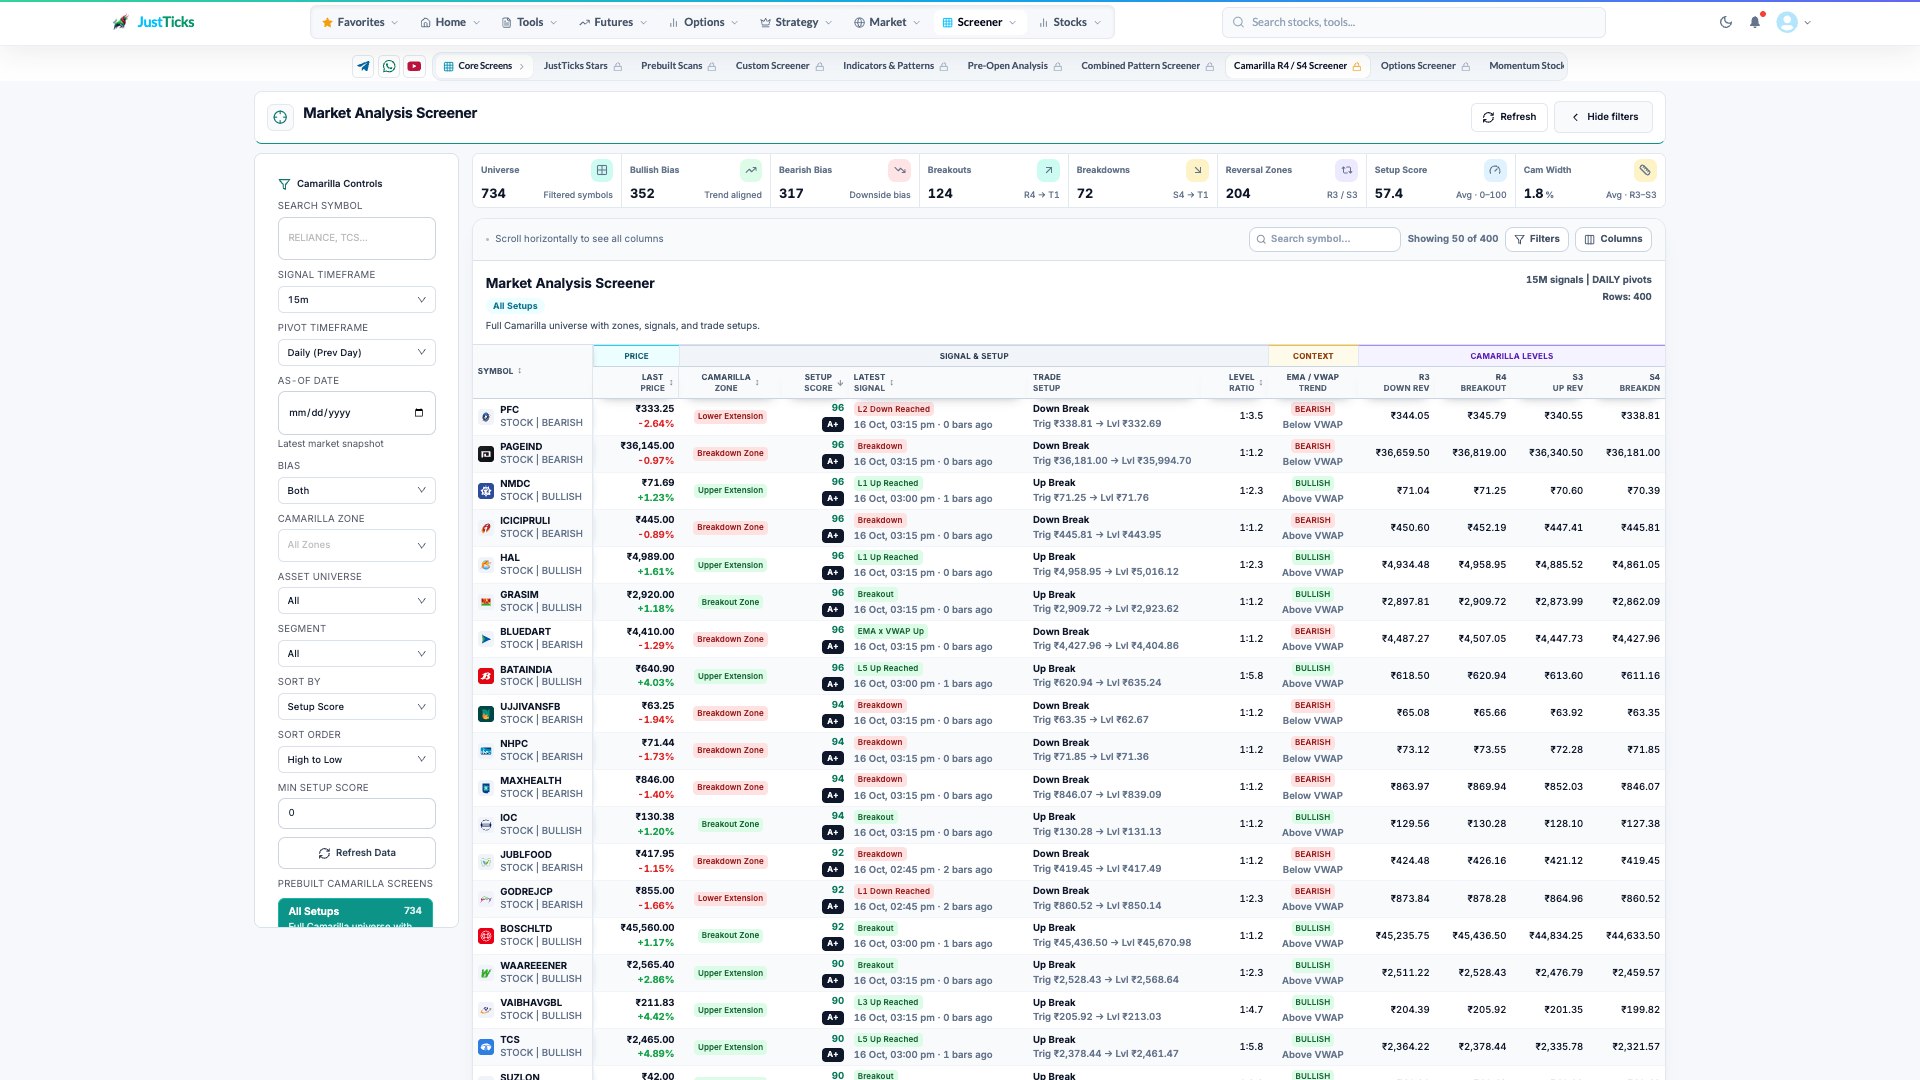
- Signal interval. The signal timeframe may differ from the daily pivot calculation.
- Pivot interval. Confirm the period used to calculate the reference levels.
- Latest signal. A new break and a level already reached describe different stages.
- Camarilla levels. Read the numeric R and S references alongside price and the recorded signal time.
- Open Market Analysis Screener, choose candle timeframe and pivot timeframe separately.
- Choose the as-of date, segment and asset type.
- Select a reversal or breakout lane according to the question you are studying.
- Inspect the exact reference prices, signal time and current zone on the chart.
- Read the score, participation and EMA/VWAP context as additional diagnostics, then compare later candles.
A zone is not the same as a transition
Price can sit between R3 and R4 without a fresh R3 crossunder. The zone describes location; a crossunder describes movement from one side of a reference to the other. The same distinction applies to a stock below S4 versus a new S4 breakdown.
References can fail or change
- A previous-period level is calculated, not a guaranteed pocket of supply or demand.
- A developing candle can change the apparent transition.
- A model target ladder is a set of reference prices, not promised profit.
- Large extension beyond a reference changes the practical interpretation of a historical signal.