
What this tool helps you investigate
Use the price range screener to compare where stocks trade inside several historical high-low windows and how those windows widen or contract. The workspace shows daily through longer-term ranges in one row.
Price location and range width are different measures. A stock can sit near the top of a narrow weekly range while remaining near the bottom of its much wider yearly range.
Read the workspace
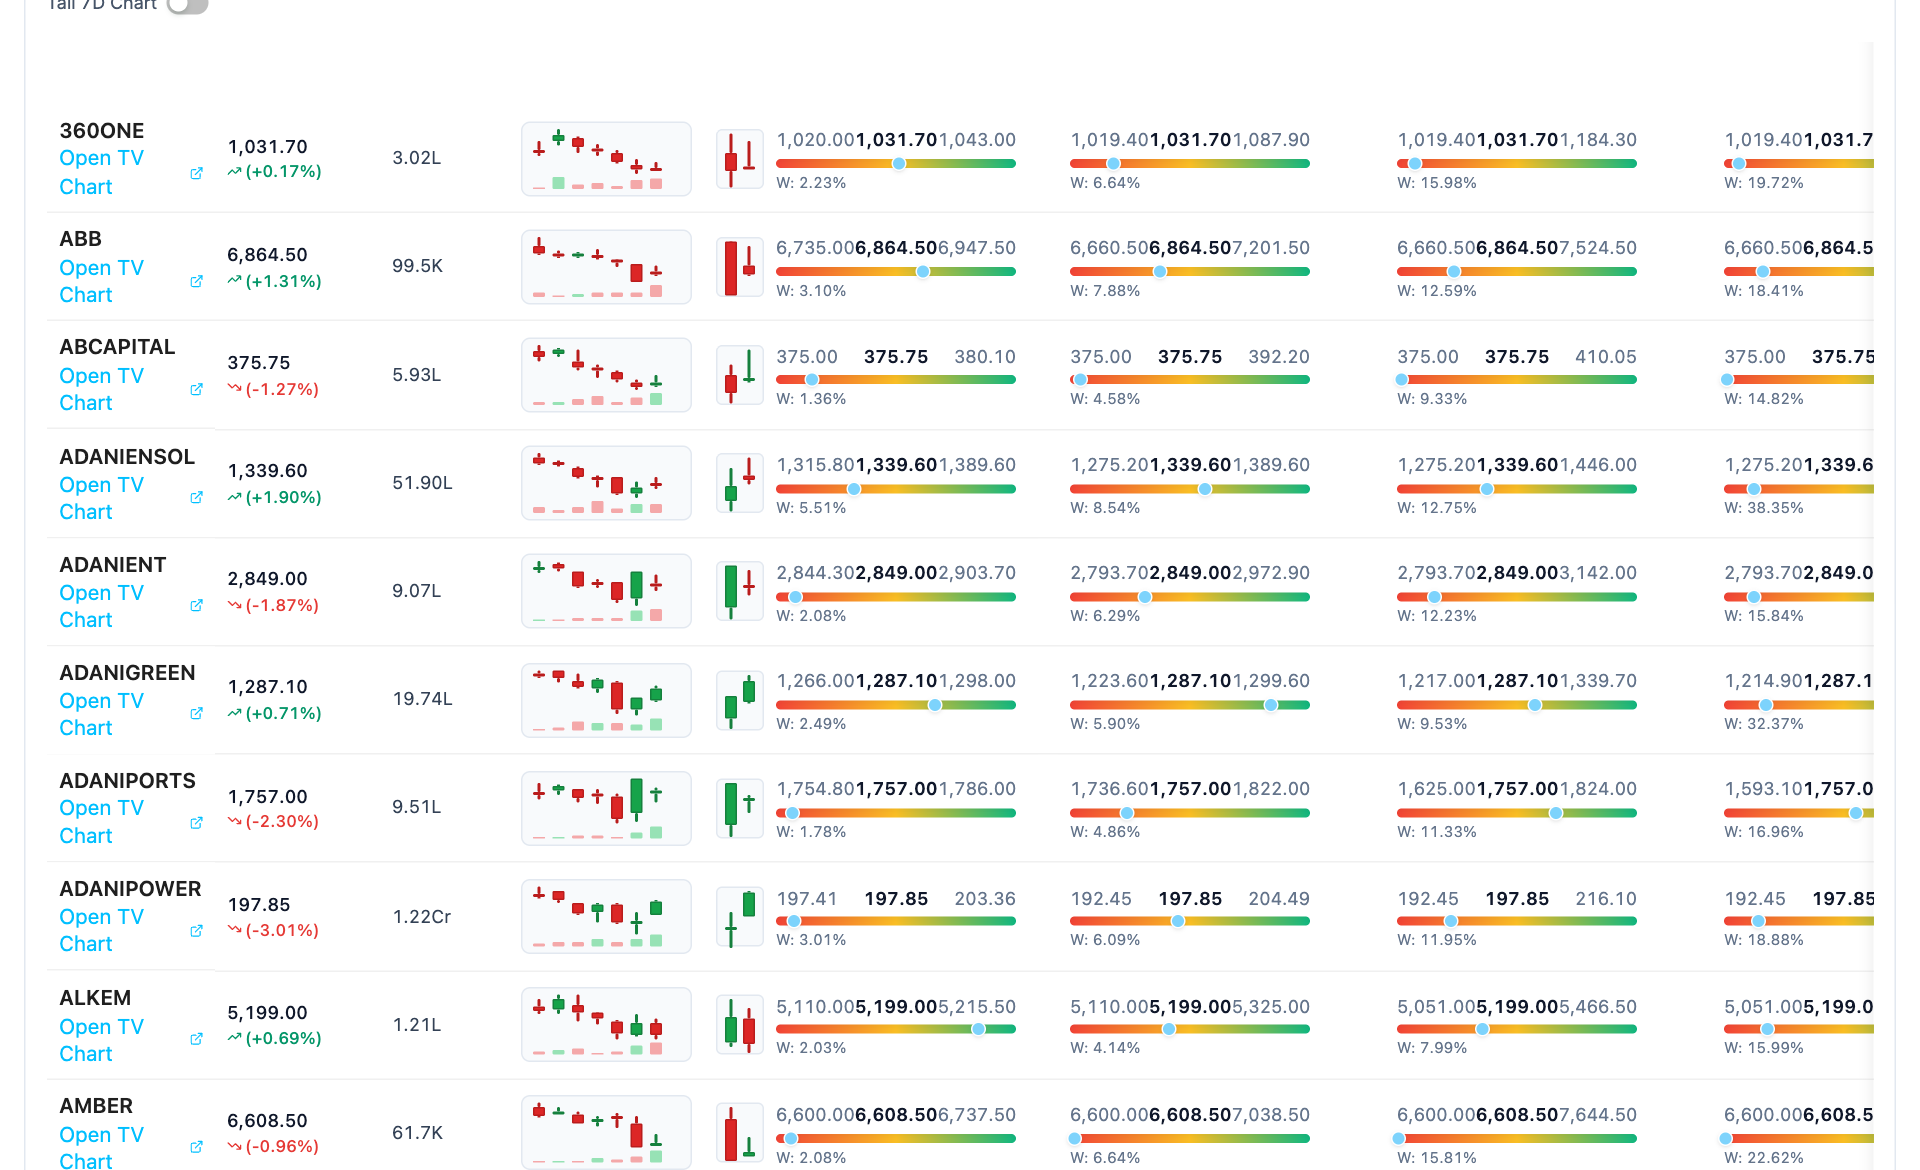
- Current price. The latest quote and daily change are distinct from the longer-window ranges.
- Recent candles. The compact chart provides price-and-volume context for the row.
- Range location. The dot shows where price sits between the selected window low and high.
- Range width. The W label describes width; it is different from the position of the dot.
How to use Price range screener
- Choose the stock universe and any available filters.
- Read the current price and recent candle context for a candidate.
- Compare low, current price and high within each labelled window.
- Use range-state classifications to find compression or expansion, then verify the history on a full chart.
Understand the measurements
| Measurement | How to read it |
|---|---|
| Window low and high | Observed extremes within the labelled session-based period. |
| Range location | Position of current price between that window low and high. |
| Range width | The size of the window range under the tool formula. |
| Expanding or in range | A rule-based comparison of shorter and longer range widths. |
A worked example
For a window low of 100 and high of 120, a price of 115 lies 75% of the way from low to high: (115 − 100) ÷ (120 − 100). This is a range location, not a 75% price return.
Worked example
This example explains the calculation or reading process. It is not a current market observation or a trade recommendation.
Checks before drawing a conclusion
- Read the window labels; the tool uses session counts for many periods.
- Corporate actions and outlier bars can affect historical extremes.
- A compressed range describes past movement and does not establish the direction of the next expansion.