
What this tool helps you investigate
Use the high-low matrix for end-of-day comparison of short and long historical price ranges. It helps distinguish a recent local high from a stock approaching a much larger historical boundary.
The tool includes model-based breakout and compression context. These ranks help order a review list; they do not guarantee a breakout or provide a future return probability.
Read the workspace
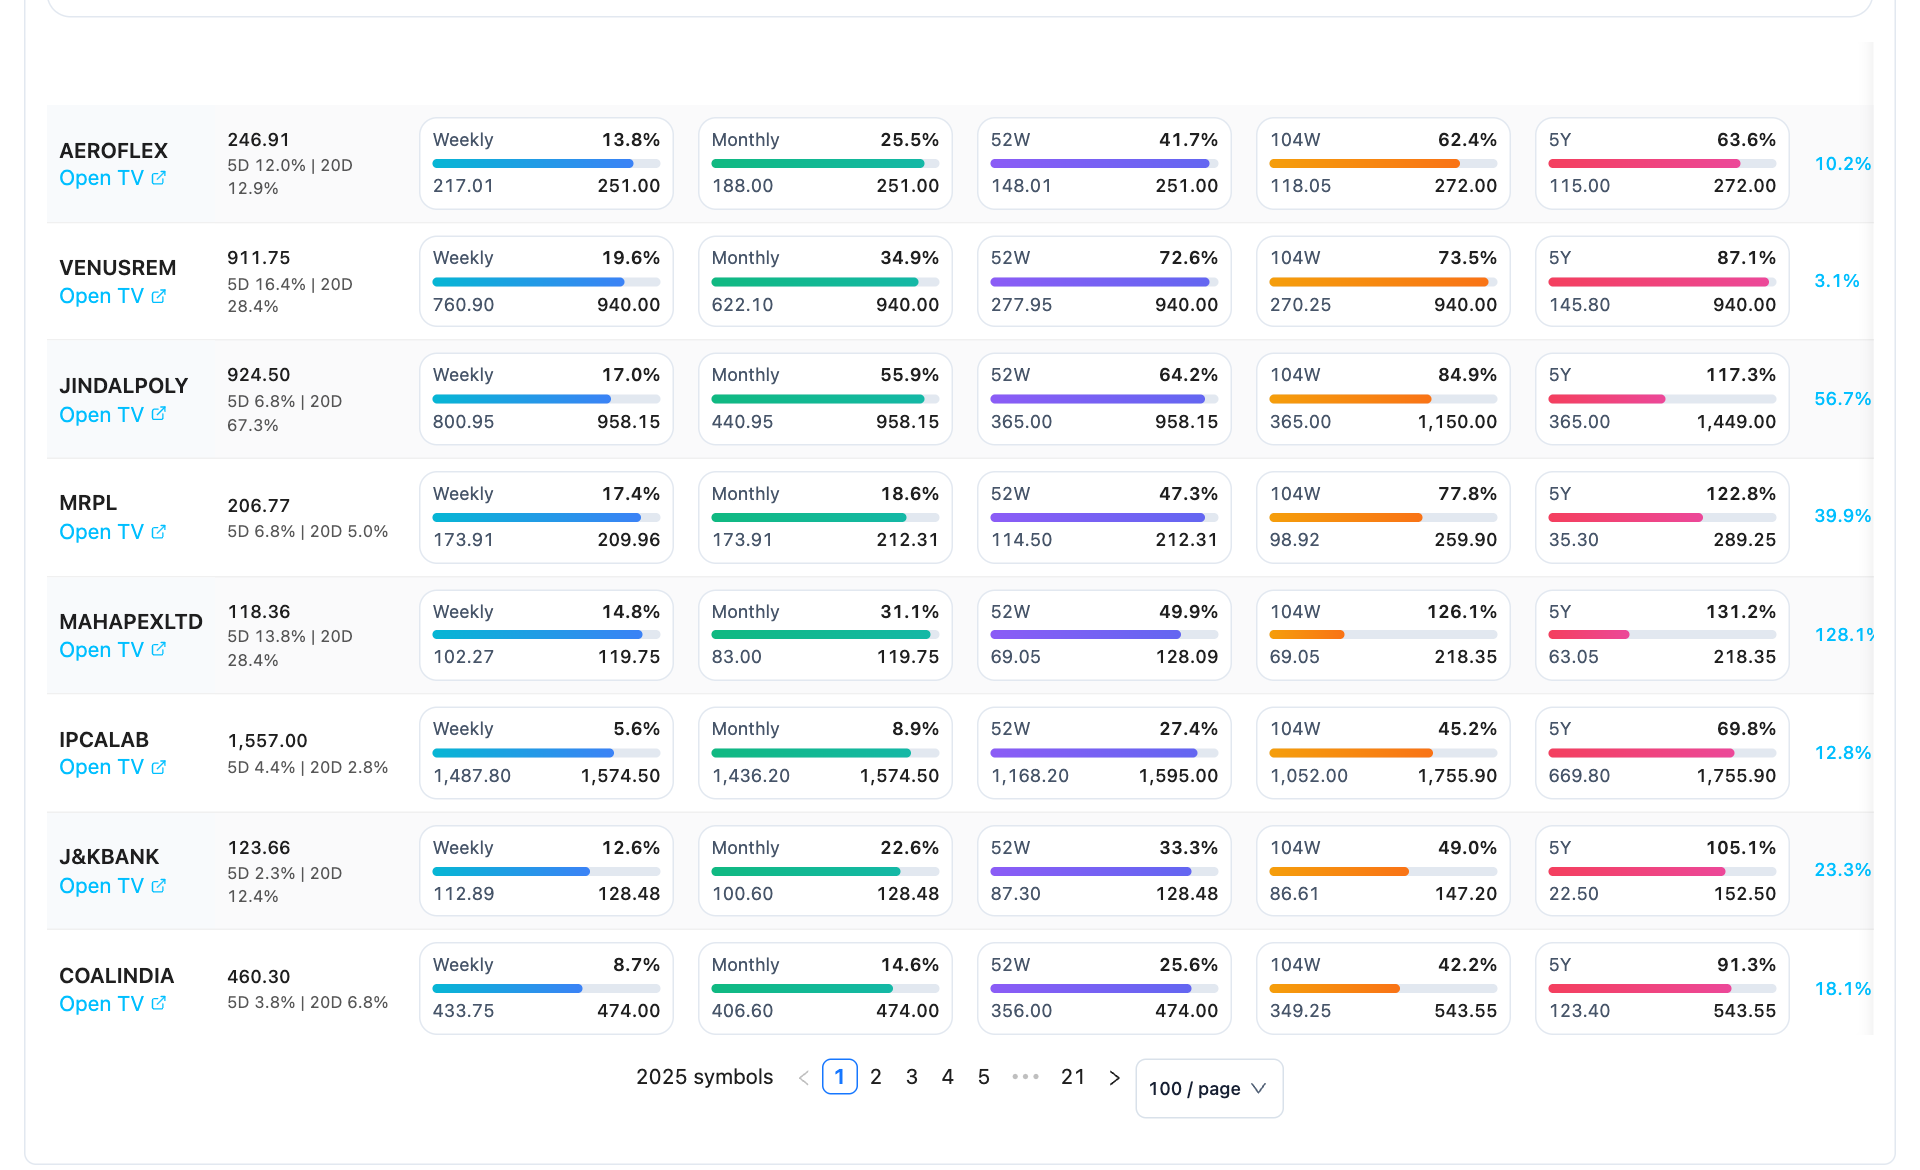
- Price and momentum. The row starts with the price and shorter-window momentum comparisons.
- Weekly range. The endpoints show the relevant window low and high.
- Longer-window context. Read monthly and yearly ranges before treating a short-window high as a broader breakout.
- Multi-year range. Longer-history comparisons require enough available observations for the stock.
How to use High-low matrix
- Choose the stock universe and required range or model filters.
- Compare the weekly and monthly low-high boundaries with the 52-week and longer windows.
- Read the price location, momentum and available all-time-high distance together.
- Open a full chart and confirm whether the apparent level is supported by enough history and traded liquidity.
Understand the measurements
| Measurement | How to read it |
|---|---|
| High and low | The historical extremes for the labelled window. |
| Location in range | Current position inside those extremes; not the return over the period. |
| Breakout rank | Model context based on proximity and supporting inputs. |
| Compression rank | A measure of narrowing short-window movement against larger windows. |
A worked example
A price of 95 can be close to a weekly high of 96 yet far below a 52-week high of 140. That is a local high inside a larger range. Reviewing both windows prevents describing it as a yearly breakout.
Worked example
This example explains the calculation or reading process. It is not a current market observation or a trade recommendation.
Checks before drawing a conclusion
- Check the report date and available history before comparing multi-year windows.
- A model rank is not an instruction to buy or sell.
- Range location, range width and percentage return use different denominators.