
What the main readings describe
| Field | Interpretation |
|---|---|
| Conviction | Composite rank of the selected price-volume evidence |
| Phase | A model label such as pre-breakout or markup |
| Flow score | Directional flow assessment from the available observations |
| Accumulation days | Number of qualifying days in the displayed comparison window |
| Setup readiness | A ranking of how current conditions match the model |
Several fields may be correlated because they share price and volume inputs. Four agreeing fields are not necessarily four independent confirmations.
Use the flow opportunity tape
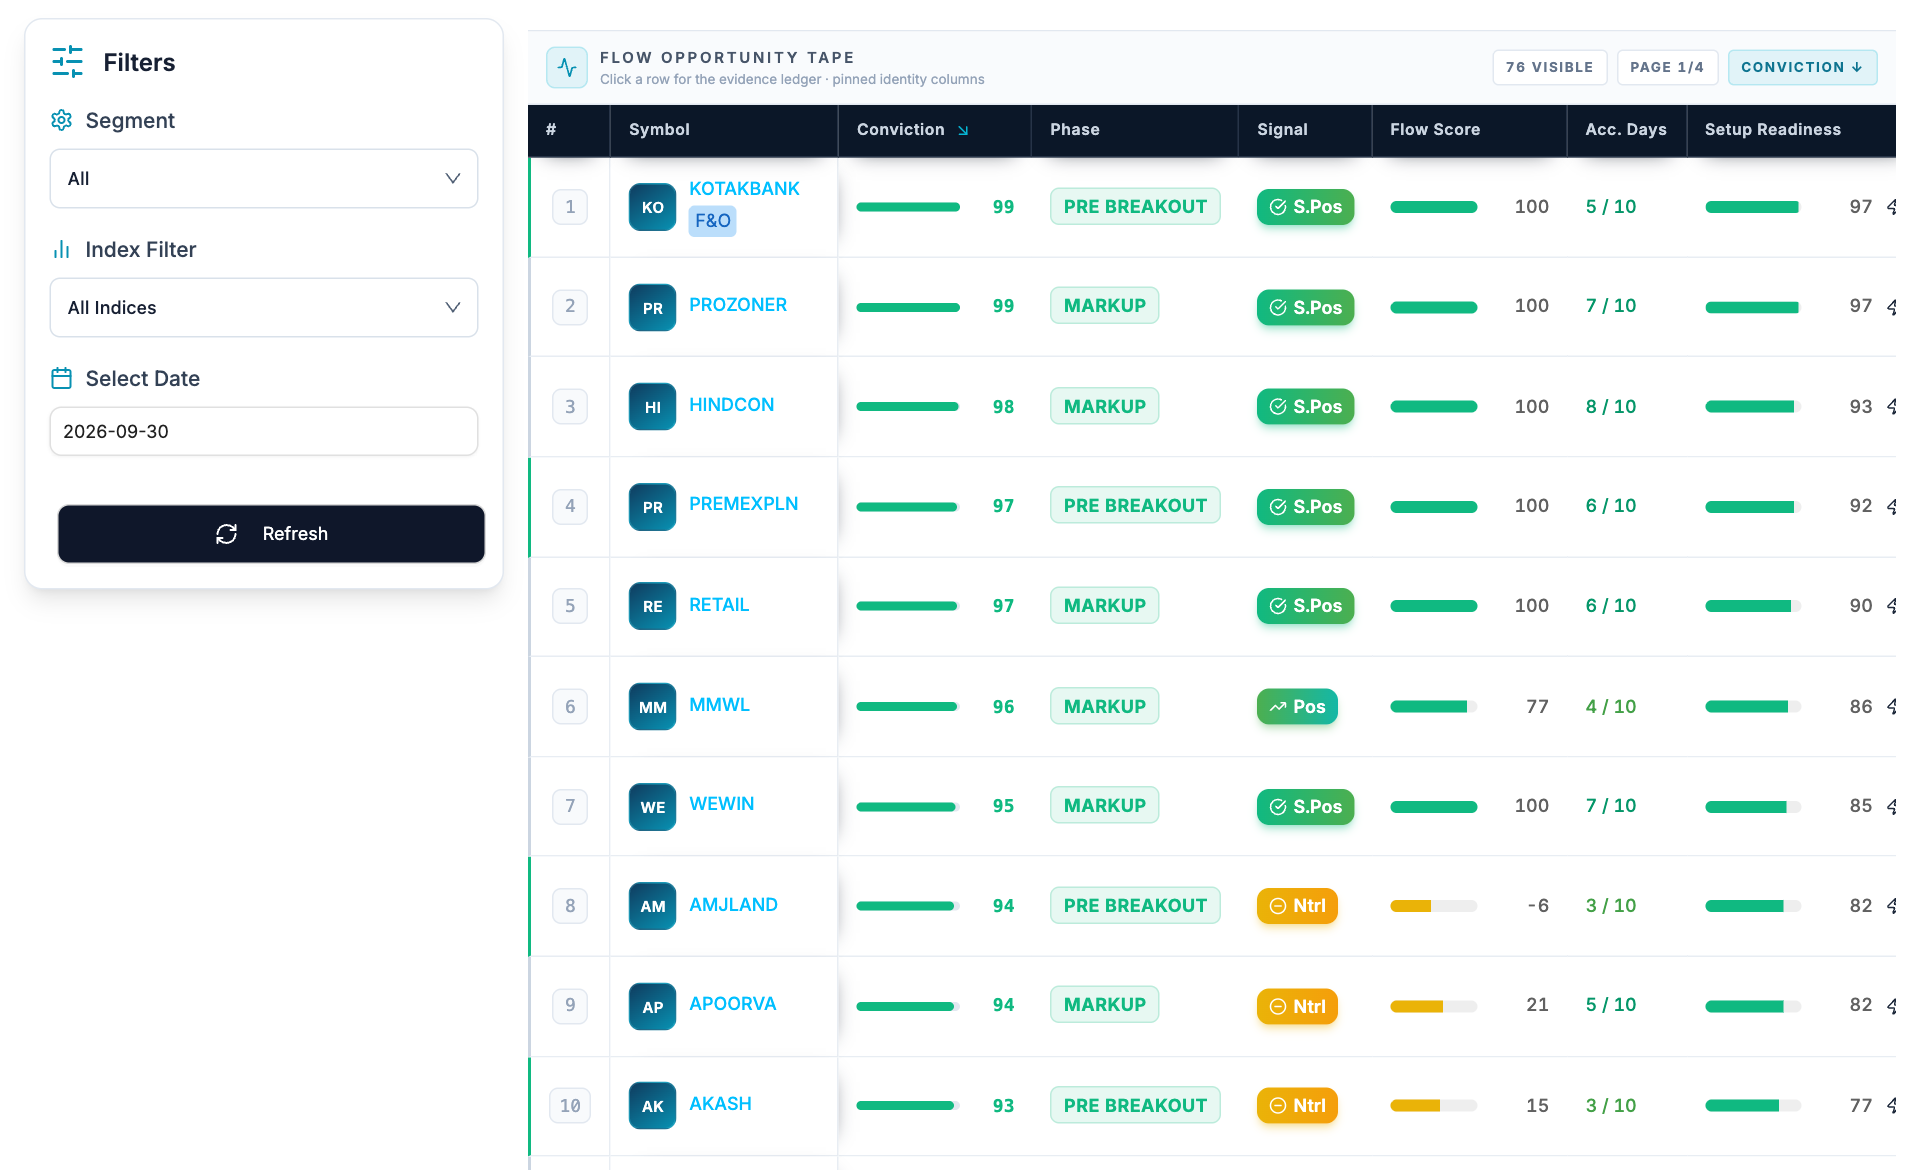
- Choose the universe. Segment and index scope determine the rows being compared.
- Fix the observation date. A historical date gives the reference for the displayed flow evidence.
- Compare rank and phase. A high rank and a pre-breakout phase describe different model outputs.
- Inspect the day count. Five of ten means five qualifying observations within that window, not a five-day return.
- Set segment, index scope and observation date.
- Sort by conviction or the specific flow measure relevant to the question.
- Read phase, flow and qualifying-day counts together.
- Select a row to inspect the evidence ledger and price-volume history.
- Compare with delivery data or the price chart while keeping the same session.
Read persistence separately from intensity
A stock can have a strong current flow score but only two qualifying days out of ten. Another can have a milder score and seven qualifying days. The first describes intensity at the observation; the second describes persistence. Neither establishes who traded or the next return.
What the model cannot establish
- OHLCV does not reveal the identity or motive of the buyer and seller.
- High volume can accompany distribution, hedging or index rebalancing.
- A phase label can change as new candles arrive.
- A readiness score is not a probability or a promised outcome.