
What the screener can and cannot rank
Each row describes a stock and the available options inputs for the selected data settings. OI PCR compares outstanding put and call positions; volume PCR compares traded contracts. The two can rank the same stocks differently.
Sentiment and setup labels are classifications generated by the application. A label such as bullish or bearish is not proof that OI belongs to buyers or writers. Inspect the raw values, expiry, quote quality and price context behind it.
Screenshot: stock filters and result rows
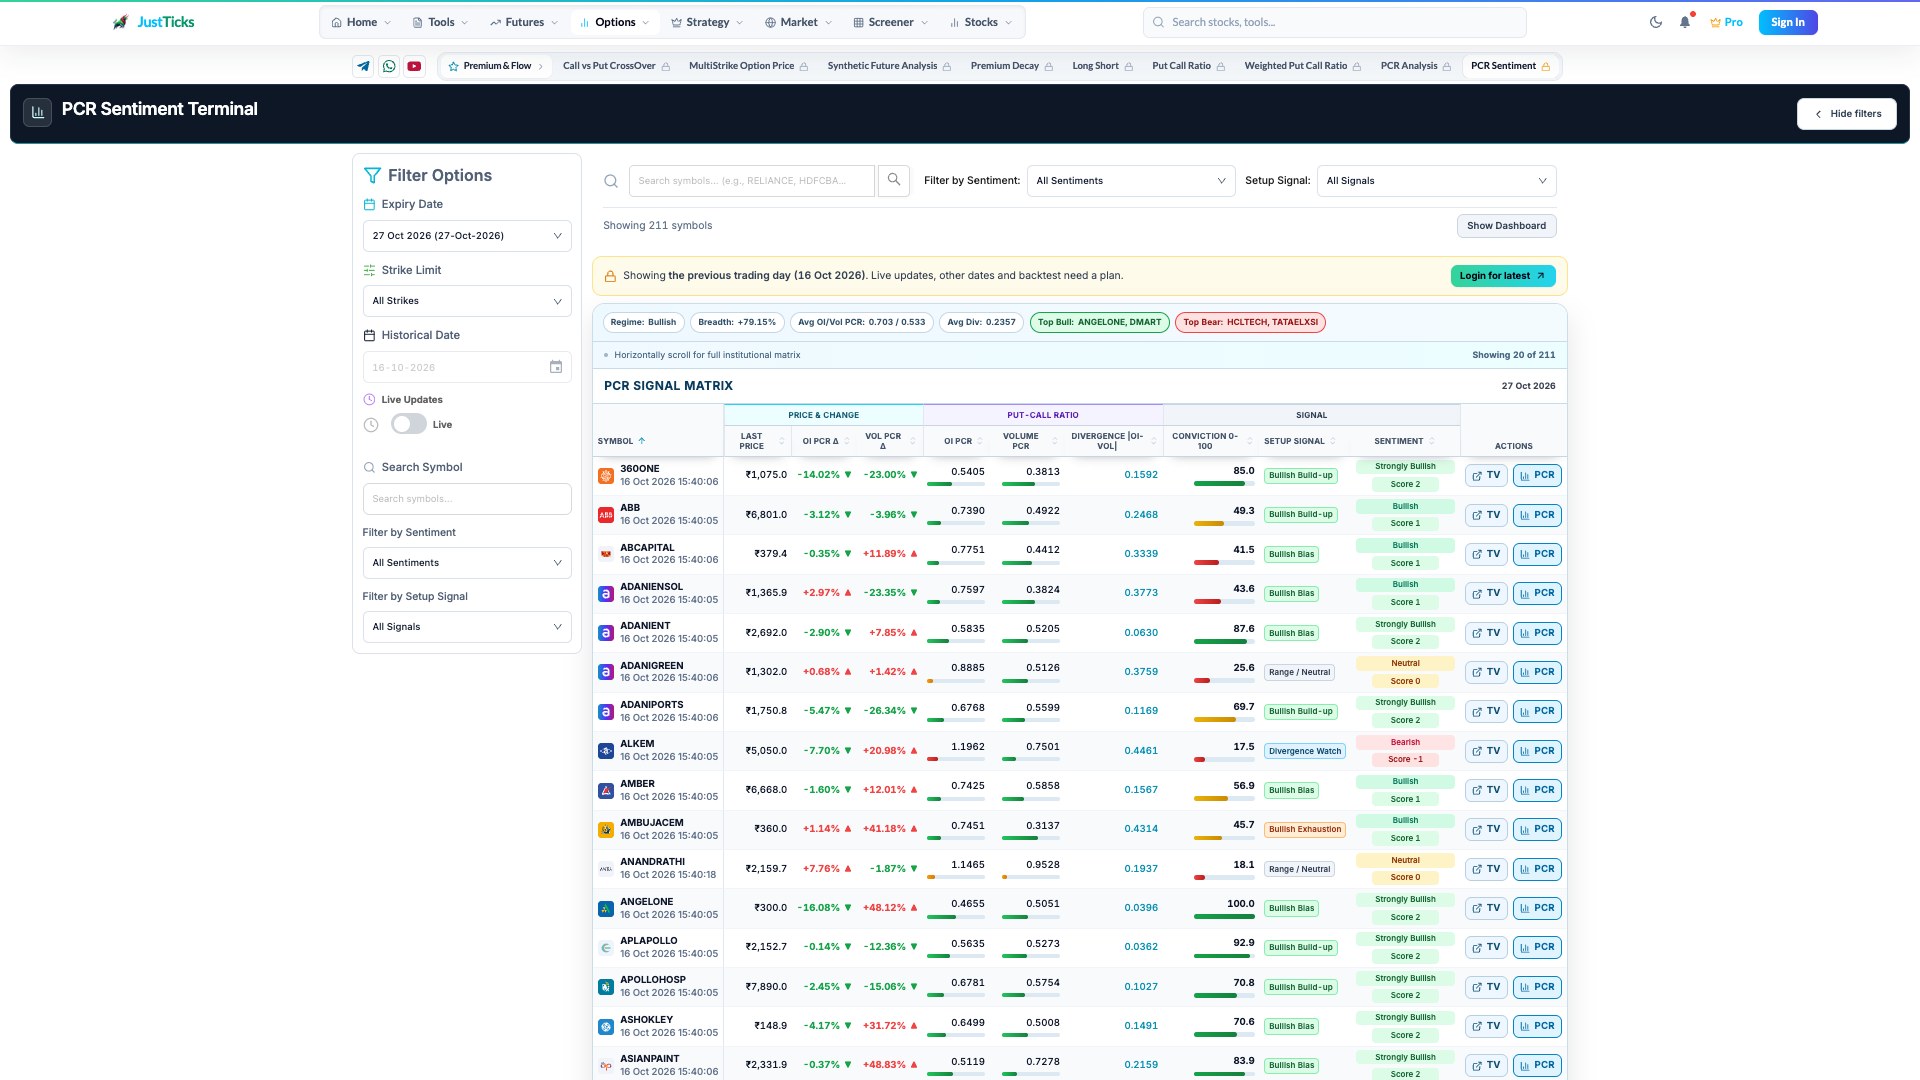
- Expiry and strikes. Keep the expiry and strike coverage comparable across stocks.
- OI and volume ratios. Outstanding positions and traded volume answer different questions.
- Derived classifications. Setup and sentiment labels are heuristics, not proof of buying or writing.
- Open the instrument. Use the row action to inspect the contract rather than relying on the stock label alone.
Build a useful shortlist
- Choose the available instrument group, expiry and data interval. Verify whether the page is showing a historical preview or live updates.
- Start with OI PCR or volume PCR and a broad range. Add the second measure only when it serves a separate question.
- Use symbol search to inspect a known stock, or sort the table to compare available extremes.
- Read sentiment and setup filters as rule-based labels. Clear them when checking whether a label hides relevant rows.
- Open the individual option chain and verify strike concentration, liquidity, underlying price and data time before drawing a conclusion.
Worked example: a high ratio from a small denominator
Stock A has put OI 100,000 and call OI 50,000, giving PCR 2.0. Stock B has put OI 1,000 and call OI 100, giving PCR 10.0. Ranking by PCR alone puts B first even though it has far less covered positioning. A large ratio is not a measure of market importance or liquidity.
These figures are illustrative. Compare absolute totals and coverage alongside the ratio, then check whether one strike dominates the result.
Avoid turning a filter into a forecast
Missing rows, changing expiry selection and sparse strikes can alter a shortlist. Ratios from different expiries are not equivalent. Refreshing the page does not guarantee every component quote has the same timestamp. Use the session PCR walkthrough to inspect a candidate in time context.