
Set the instrument, expiry and session first
- Open the instrument you want to inspect. The URL identifies the instrument; the expiry selector identifies the option contract group.
- Choose the expiry before comparing readings. A near-expiry ratio and a monthly ratio can describe different sets of positions.
- Check the selected session date and the Live updates control. A previous-session preview is historical even when the page is opened today.
- Choose one timeframe and keep it fixed. The chart and session table use the same buckets; a five-minute view is a different sampling interval from a one-minute view.
Find the readings and the chart
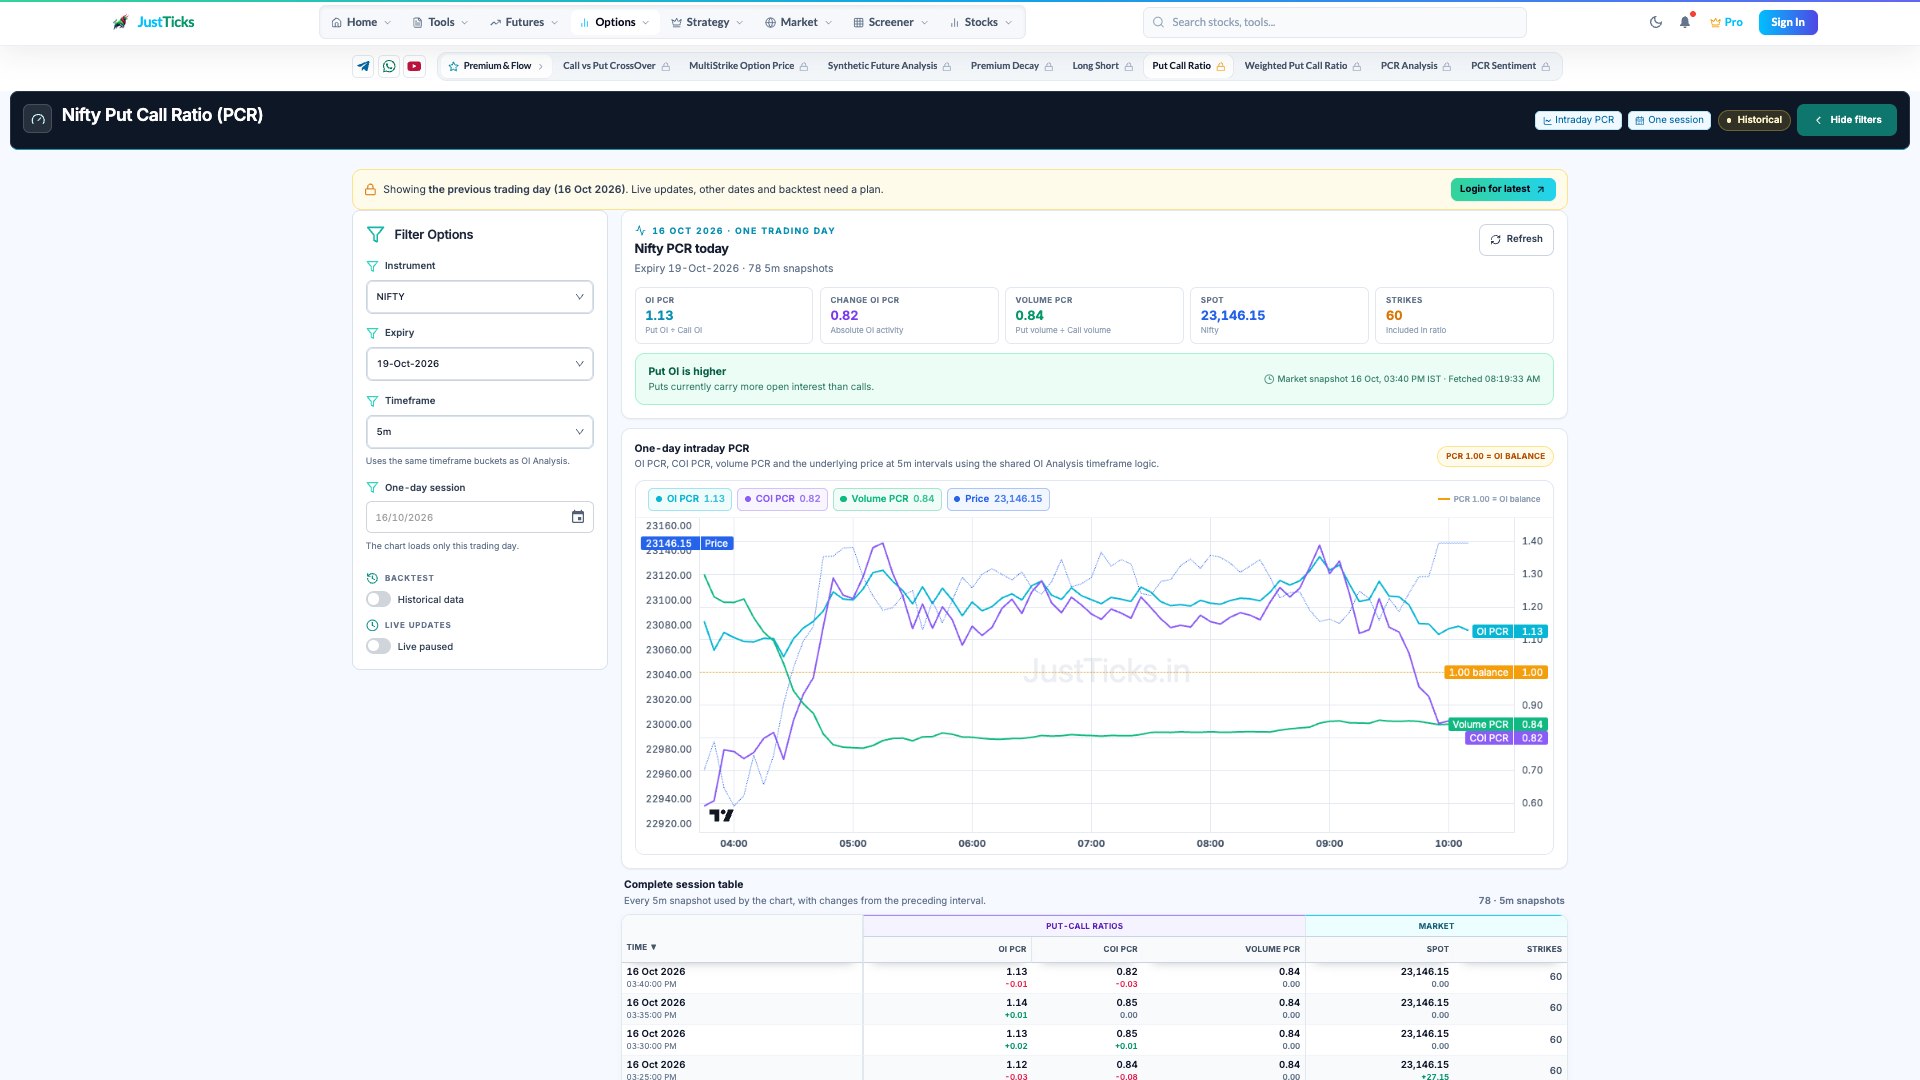
- Contract scope. Choose the instrument, expiry and five-minute sampling interval before comparing the ratios.
- Separate ratios. OI, change-OI and volume PCR use different inputs. Spot is a price, not another ratio.
- Series and scales. Match each line to its legend and use its axis; a visual crossing does not establish equal values.
- Session ledger. Check the timestamp and strike coverage behind an observation.
Start with the summary cards, then follow the matching line labels. Spot is a price in index points; PCR is a unitless ratio. The two axes have different scales, so lines crossing visually does not mean their values are equal.
Read the three ratios separately
| Reading | What it compares | What to check |
|---|---|---|
| OI PCR | Put open interest divided by call open interest | Same expiry and included strike coverage |
| Change-OI PCR | Put and call OI activity under the page's change convention | Check whether the view uses absolute activity or signed changes; do not equate it with outstanding OI |
| Volume PCR | Put traded volume divided by call traded volume | Same session and snapshot time; volume includes repeated trading |
In the historical screenshot, OI PCR is 1.13 while volume PCR is 0.84. That means outstanding put OI exceeds call OI in the covered chain, while call trading volume exceeds put volume. Those statements can both be true; neither identifies who bought or sold the options.
Verify a movement in the session table
- Select a chart time and compare its reading with the session table for the same bucket.
- Check whether put OI increased, call OI decreased, or both before explaining a rise in OI PCR.
- Read the market-data time separately from the page's fetch time. Refreshing an old snapshot does not make it a current observation.
- If comparing another provider, match expiry, strike coverage, timestamp and the ratio formula first. A different number is not, by itself, evidence of an error.
Choose the next tool for your question
For an earlier session or several days of context, open multi-day PCR analysis. For premium turnover or share-equivalent weighting, use weighted PCR. For a fixed cross-instrument basket use Combined PCR; for filtering stock readings use the PCR stock screener.
For definitions and interpretation, return to the put-call ratio learning path. You do not need all of these tools for every question.
When the reading is incomplete
A zero or missing call denominator makes a ratio unavailable or unstable. Sparse strikes, stale snapshots and expiry changes also reduce comparability. Treat an unavailable value as missing data rather than as zero. PCR describes the covered options, not a guaranteed price outcome.