
What belongs to the basket
The dashboard includes Sensex, Nifty and Bank Nifty alongside a selected group of stock-option chains. Use the basket selector to distinguish indices, stocks or the combined view. Check the component table; the result is only about the instruments actually included.
The comparison instrument and metric also matter. OI PCR, OI-change PCR and volume PCR compare different inputs, so changing the metric changes the question. An aggregate need not equal the simple arithmetic average of component ratios.
Screenshot: aggregate, benchmark and components
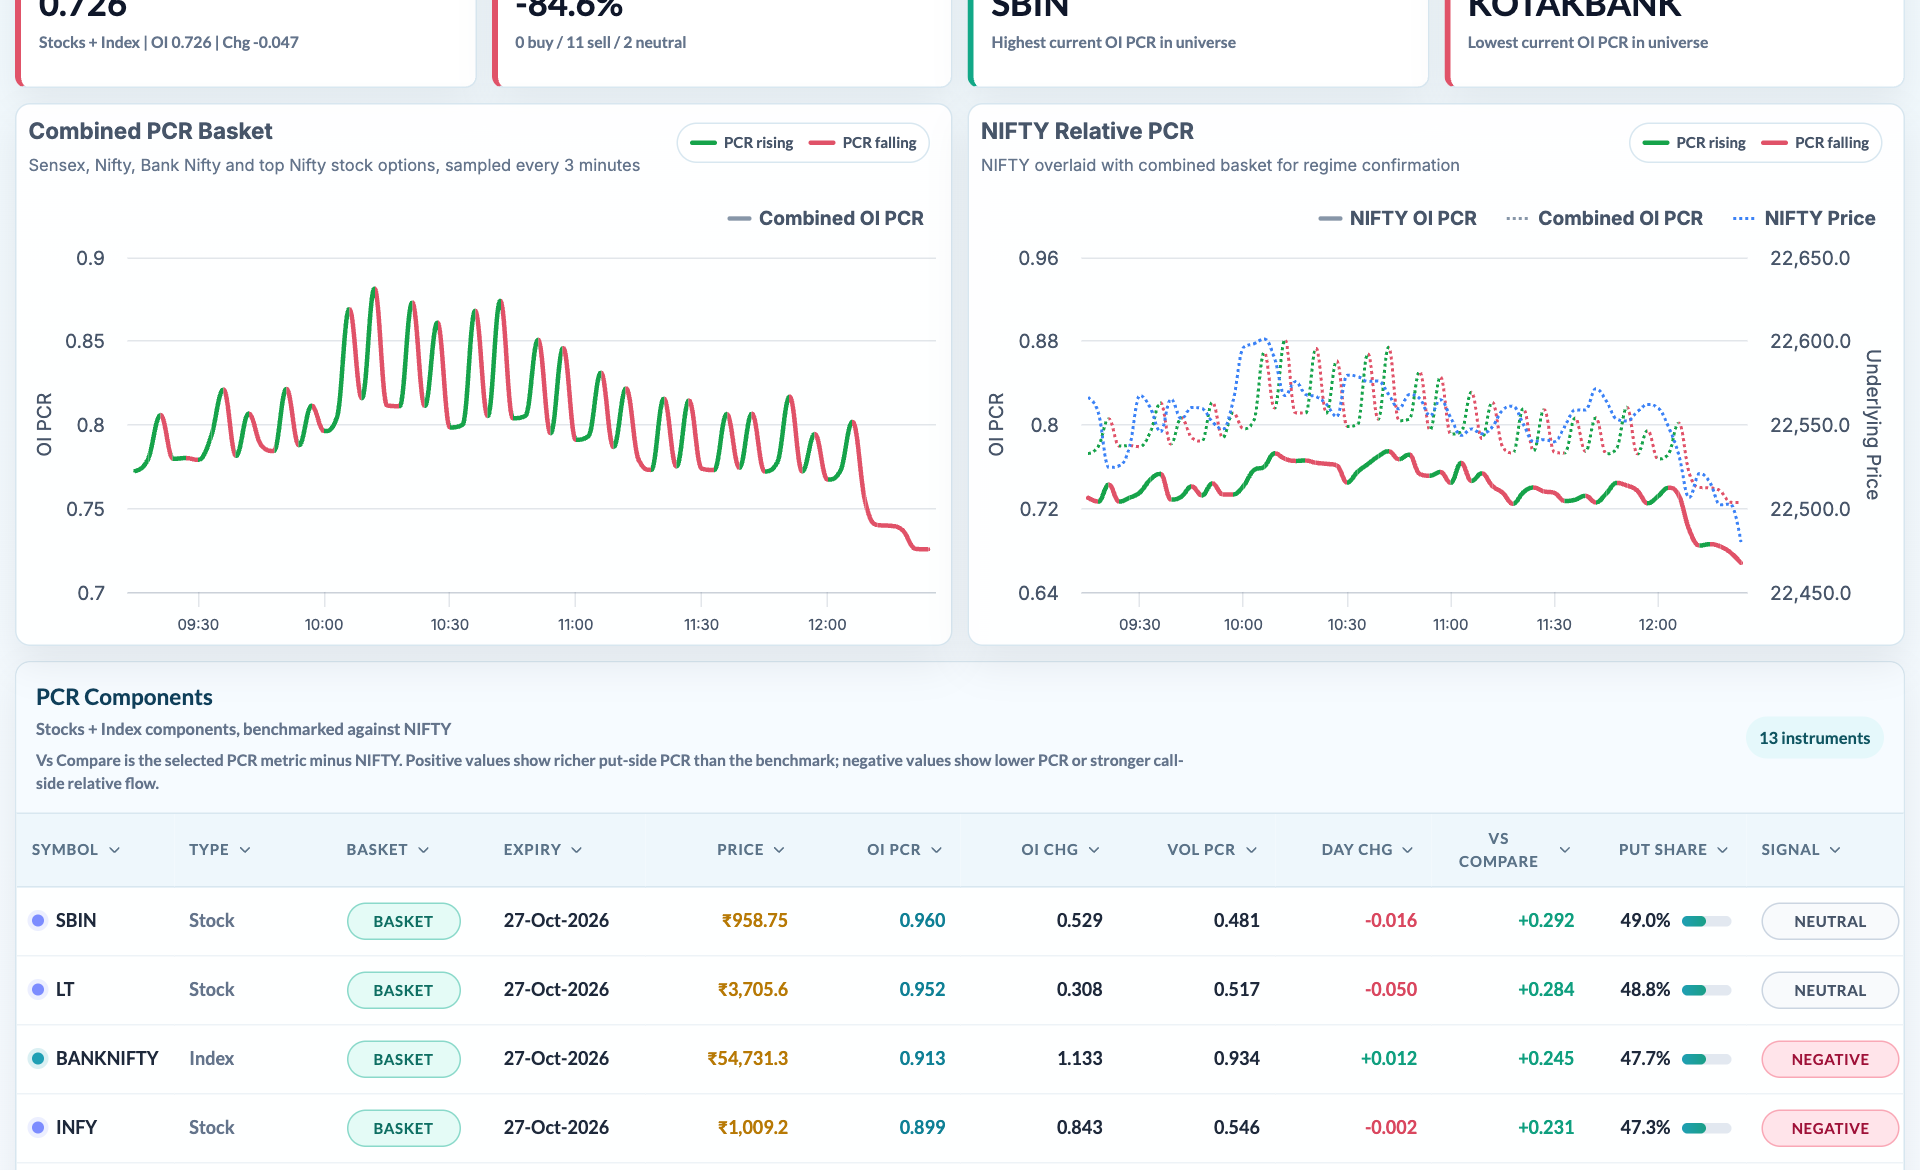
- Basket scope. The chart label identifies which instruments enter the aggregate.
- Comparison series. Read the benchmark and basket separately, using the labeled scales.
- Component table. Inspect expiry and individual readings to understand what drives the basket.
Compare a basket with an index
- Choose the basket: indices, the selected stocks or their combined view.
- Select OI PCR, OI-change PCR or volume PCR and keep it fixed for the comparison.
- Choose the benchmark instrument and expiry setting. Read the series labels and the observation time.
- Compare the two lines through the session, then inspect component rows rather than assigning a cause from the aggregate alone.
- Open an individual instrument in the session PCR chart when it contributes a large divergence.
Worked example: aggregate versus simple average
Suppose one component has put OI 100 and call OI 100, and another has put OI 900 and call OI 300. Their ratios are 1 and 3. The simple average is 2, but the ratio of combined OI totals is 1,000 ÷ 400 = 2.5. Different aggregation methods answer different questions.
This arithmetic example illustrates why checking methodology and component weights matters; it is not a claim that every dashboard mode uses this exact aggregation.
Read breadth and divergence carefully
Basket composition, contract sizes, expiry distance and denominator size can concentrate the result in a few instruments. A divergence does not establish broad-market direction. Use the component table and matching data times before treating two ratios as directly comparable.