
The four classifications
| Price | OI | Conventional label |
|---|---|---|
| Rising | Rising | Long buildup |
| Falling | Rising | Short buildup |
| Rising | Falling | Short covering |
| Falling | Falling | Long unwinding |
The sign matrix summarizes two aggregate observations. It does not prove that all new contracts were initiated by bullish buyers or bearish sellers, and both sides exist on every outstanding contract.
Compare a consistent buildup period
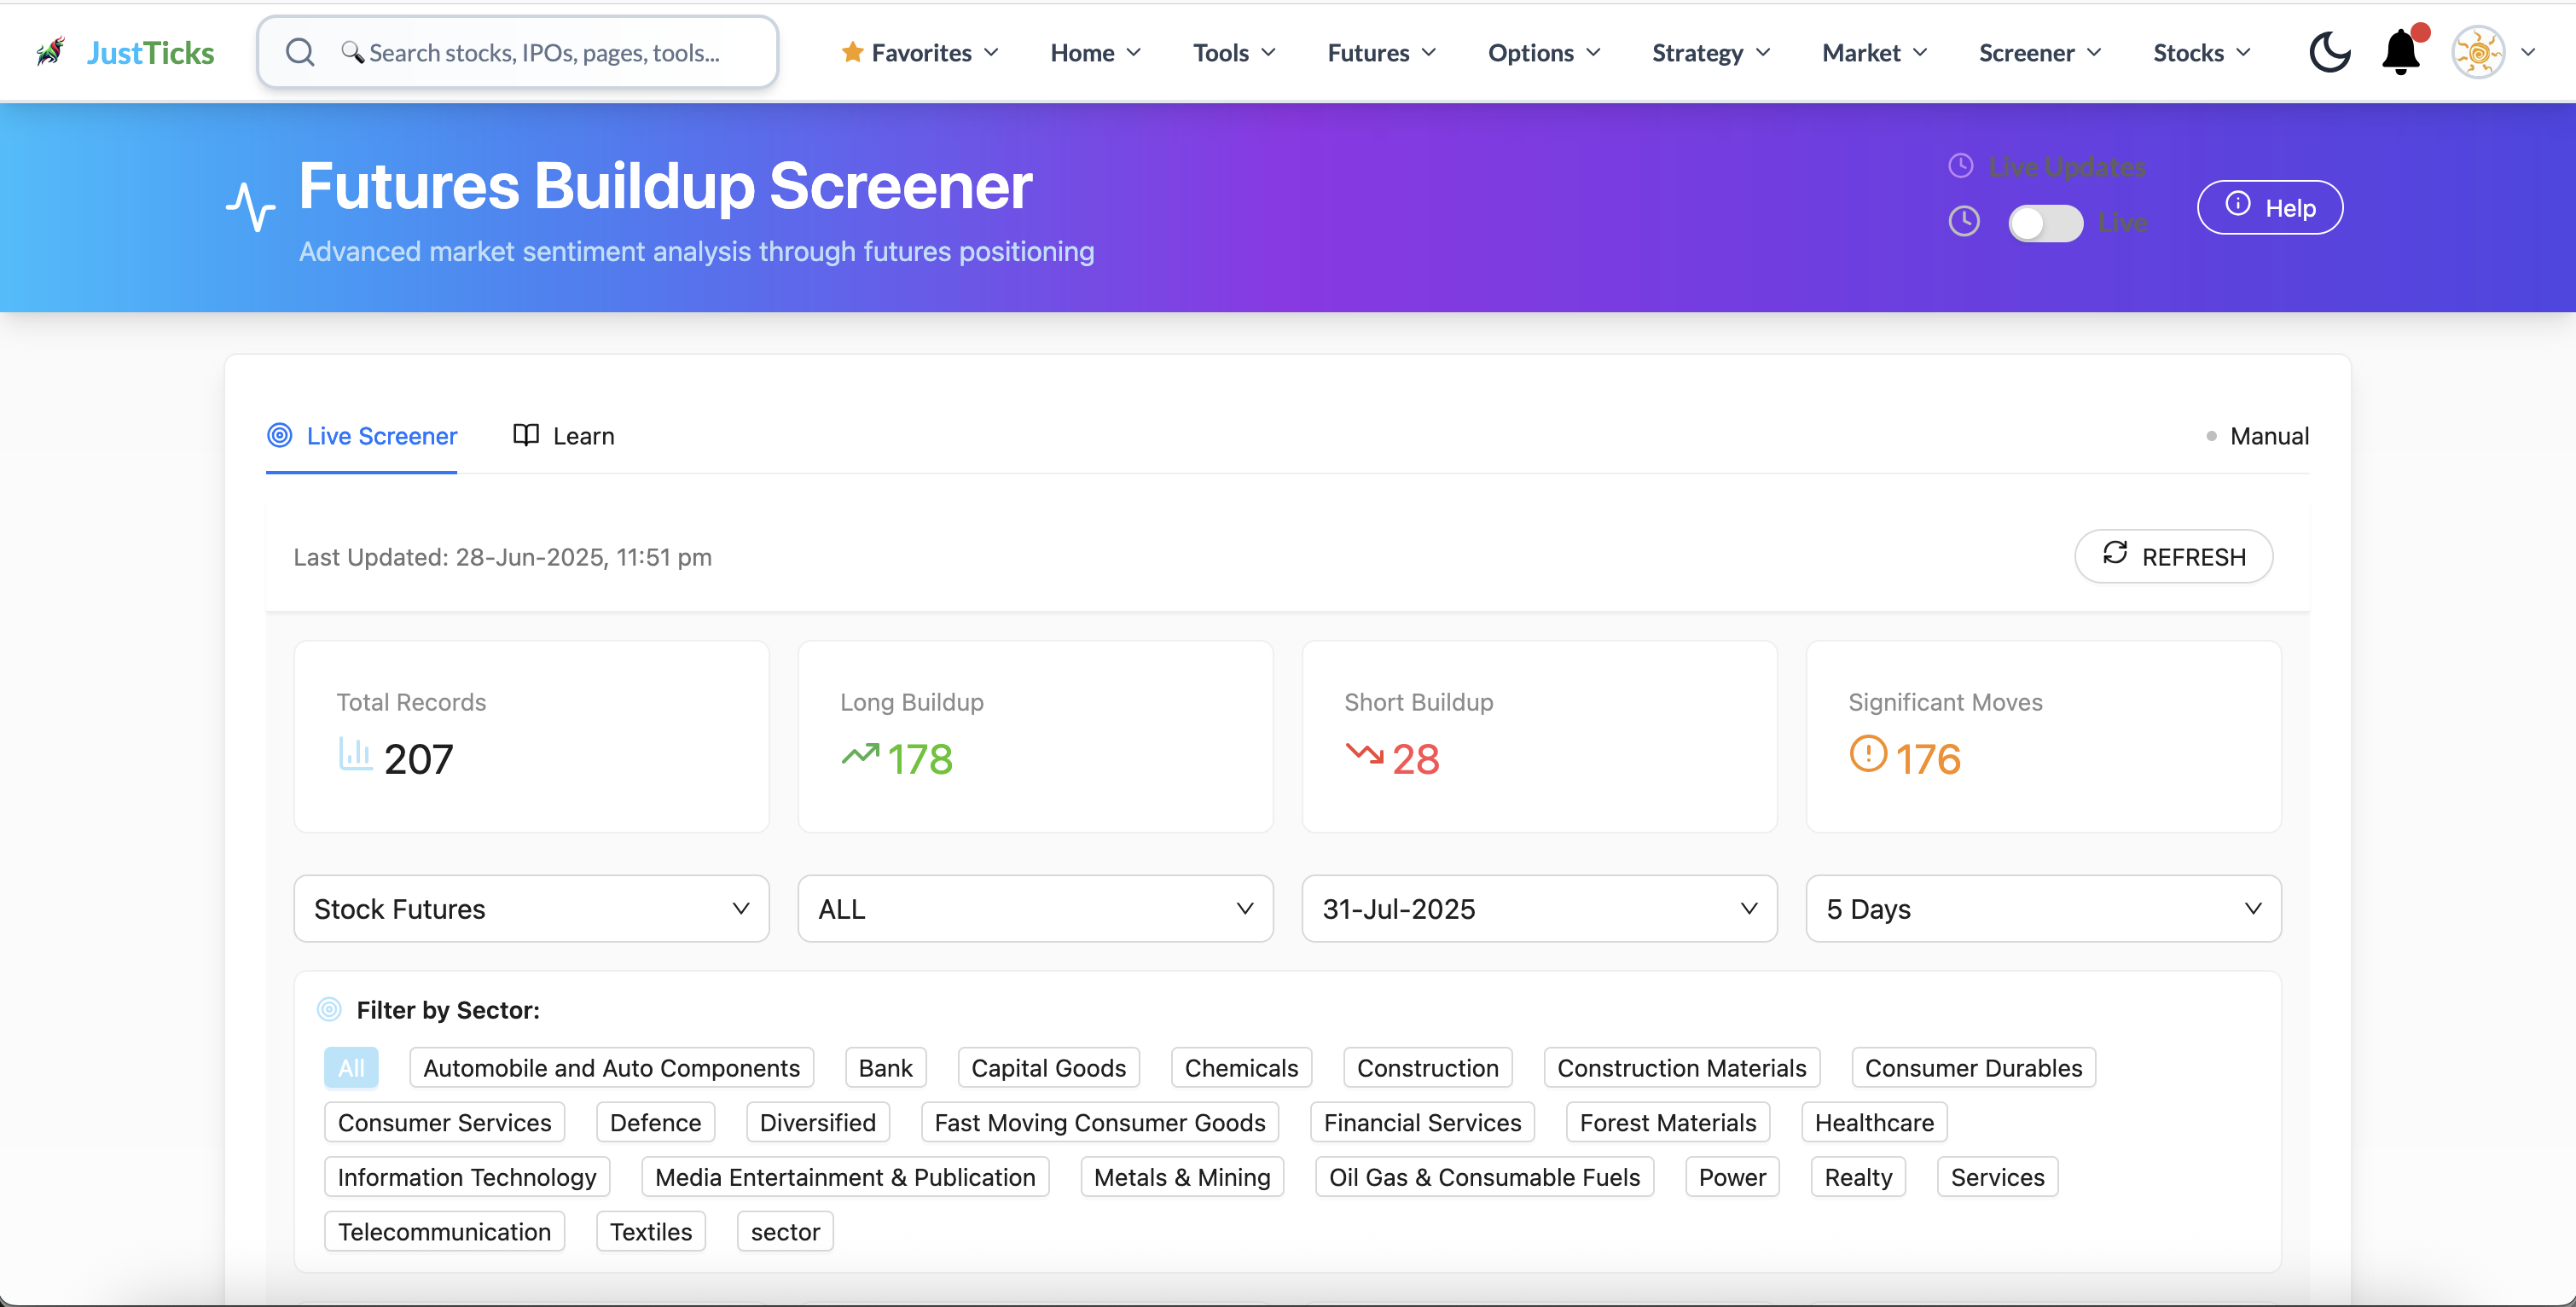
- Check the observation time. The displayed update belongs to this historical example.
- Read the quadrant counts. Counts summarize the selected universe and period.
- Match expiry and period. The contract and history window define each price/OI comparison.
- Refine by sector. Sector filters narrow the same classification universe.
- Open Futures Buildup Screener, choose asset type and expiry.
- Set the observation period and choose live or a historical session.
- Decide whether the scan should combine expiries, then keep that choice fixed.
- Select one classification and compare price change, OI change, volume and sector.
- Open a candidate to check persistence and price structure rather than inferring strength from the quadrant alone.
Classification depends on the interval
If price rises 1.2% while OI falls 3% during the selected period, the row is conventionally called short covering. If the next interval has rising price and rising OI, it becomes long buildup for that interval. These labels can coexist across different windows without contradiction.
Watch rollover and small bases
- Near expiry, rolling activity can dominate OI changes.
- A small starting OI makes percentage changes look large.
- A classification is not a forecast or a strategy result.
- Volume and OI are different: a contract can trade many times while total outstanding OI changes little.