
What this tool helps you investigate
Use advanced volume analysis to shortlist stocks whose price, volume and delivery inputs resemble a particular phase, then inspect the supporting observations. It combines several views rather than relying on one volume spike.
OBV signs volume by price direction; the accumulation/distribution line weights volume by the close location within a bar. Both are proxies. Neither identifies the owner behind a trade.
Read the workspace
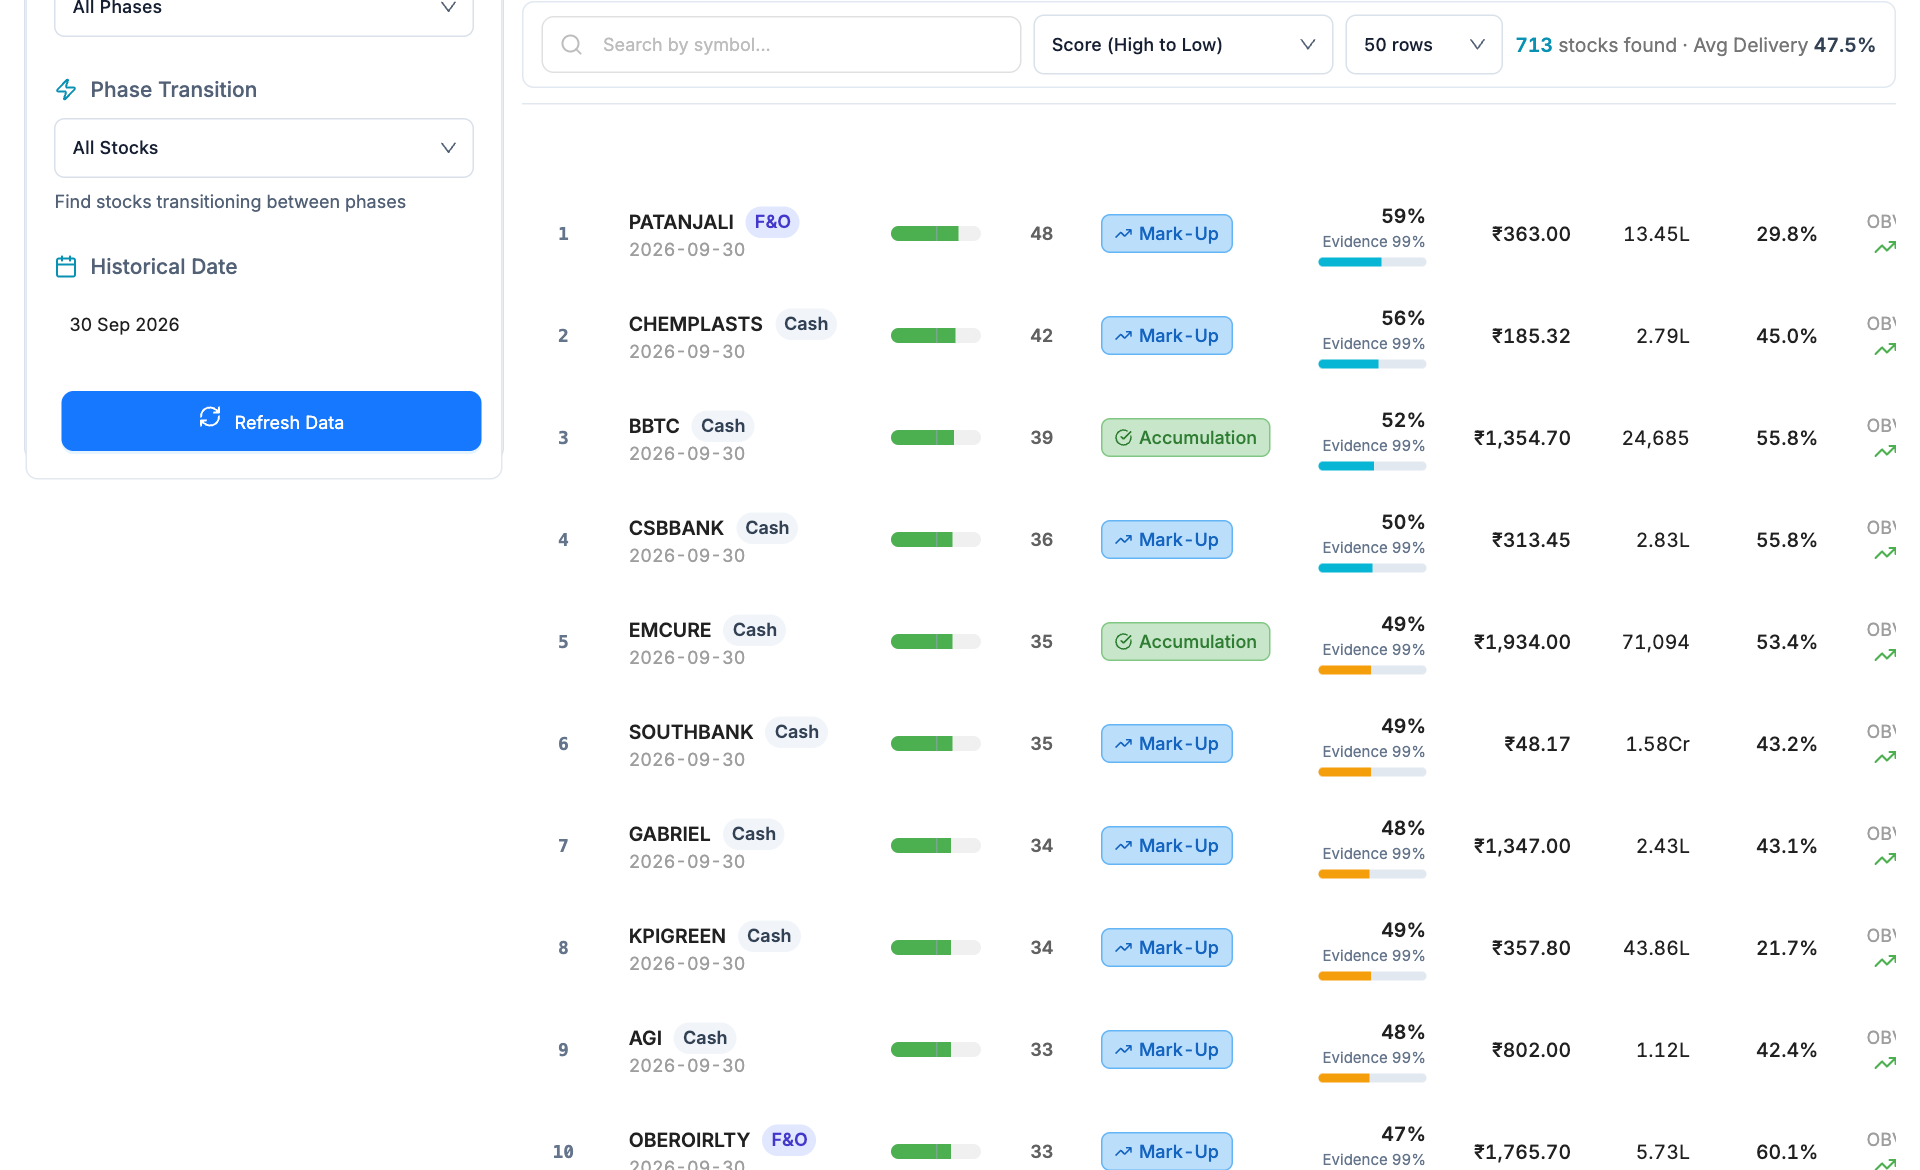
- Phase transition filter. Use the phase and transition controls to choose which model classifications appear.
- Historical session. Confirm the report date; delivery context generally describes a completed session.
- Phase label. Mark-Up and Accumulation are classifications from price-volume inputs, not observed trader identities.
- Evidence score. Read model evidence separately from delivery percentage and absolute traded volume.
How to use Advanced volume analysis
- Choose the stock universe and historical date.
- Filter by phase or a phase transition such as accumulation to markup.
- Compare phase, model evidence, traded volume and delivery percentage for each result.
- Inspect the underlying chart and preceding sessions to see whether the pattern persists.
Understand the measurements
| Measurement | How to read it |
|---|---|
| OBV | A cumulative price-direction-based volume series. |
| A/D line | A close-location-weighted cumulative volume measure. |
| Phase label | A rule-based classification such as Accumulation, Distribution, Mark-Up or Mark-Down. |
| Evidence | Support from the model inputs, not a calibrated probability of future price movement. |
A worked example
Two stocks may both carry an Accumulation label, but one has only a single high-volume session while the other shows repeated supporting observations. The second offers more persistence to investigate; neither label reveals who accumulated shares.
This example explains the calculation or reading process. It is not a current market observation or a trade recommendation.
Checks before drawing a conclusion
- Match the historical date before combining delivery and price observations.
- A phase label is an inference from market data, not a disclosure of institutional buying.
- Corporate actions, news and small volume bases can distort indicator changes.