
What the multi-day workspace adds
The workspace plots available observations across the chosen date window. OI PCR and volume PCR describe different option-chain totals; Premium WPCR and Delta-OI WPCR use different weights. Underlying price is kept as context, with its own scale. The selected window is a request for available history, not a guarantee that every date has data.
Use the session PCR chart when the question concerns one day at a fixed intraday interval. Use multi-day analysis when you need to compare recent levels, see persistence or check whether an apparent extreme is unusual within the available sample.
Screenshot: the history window and metrics
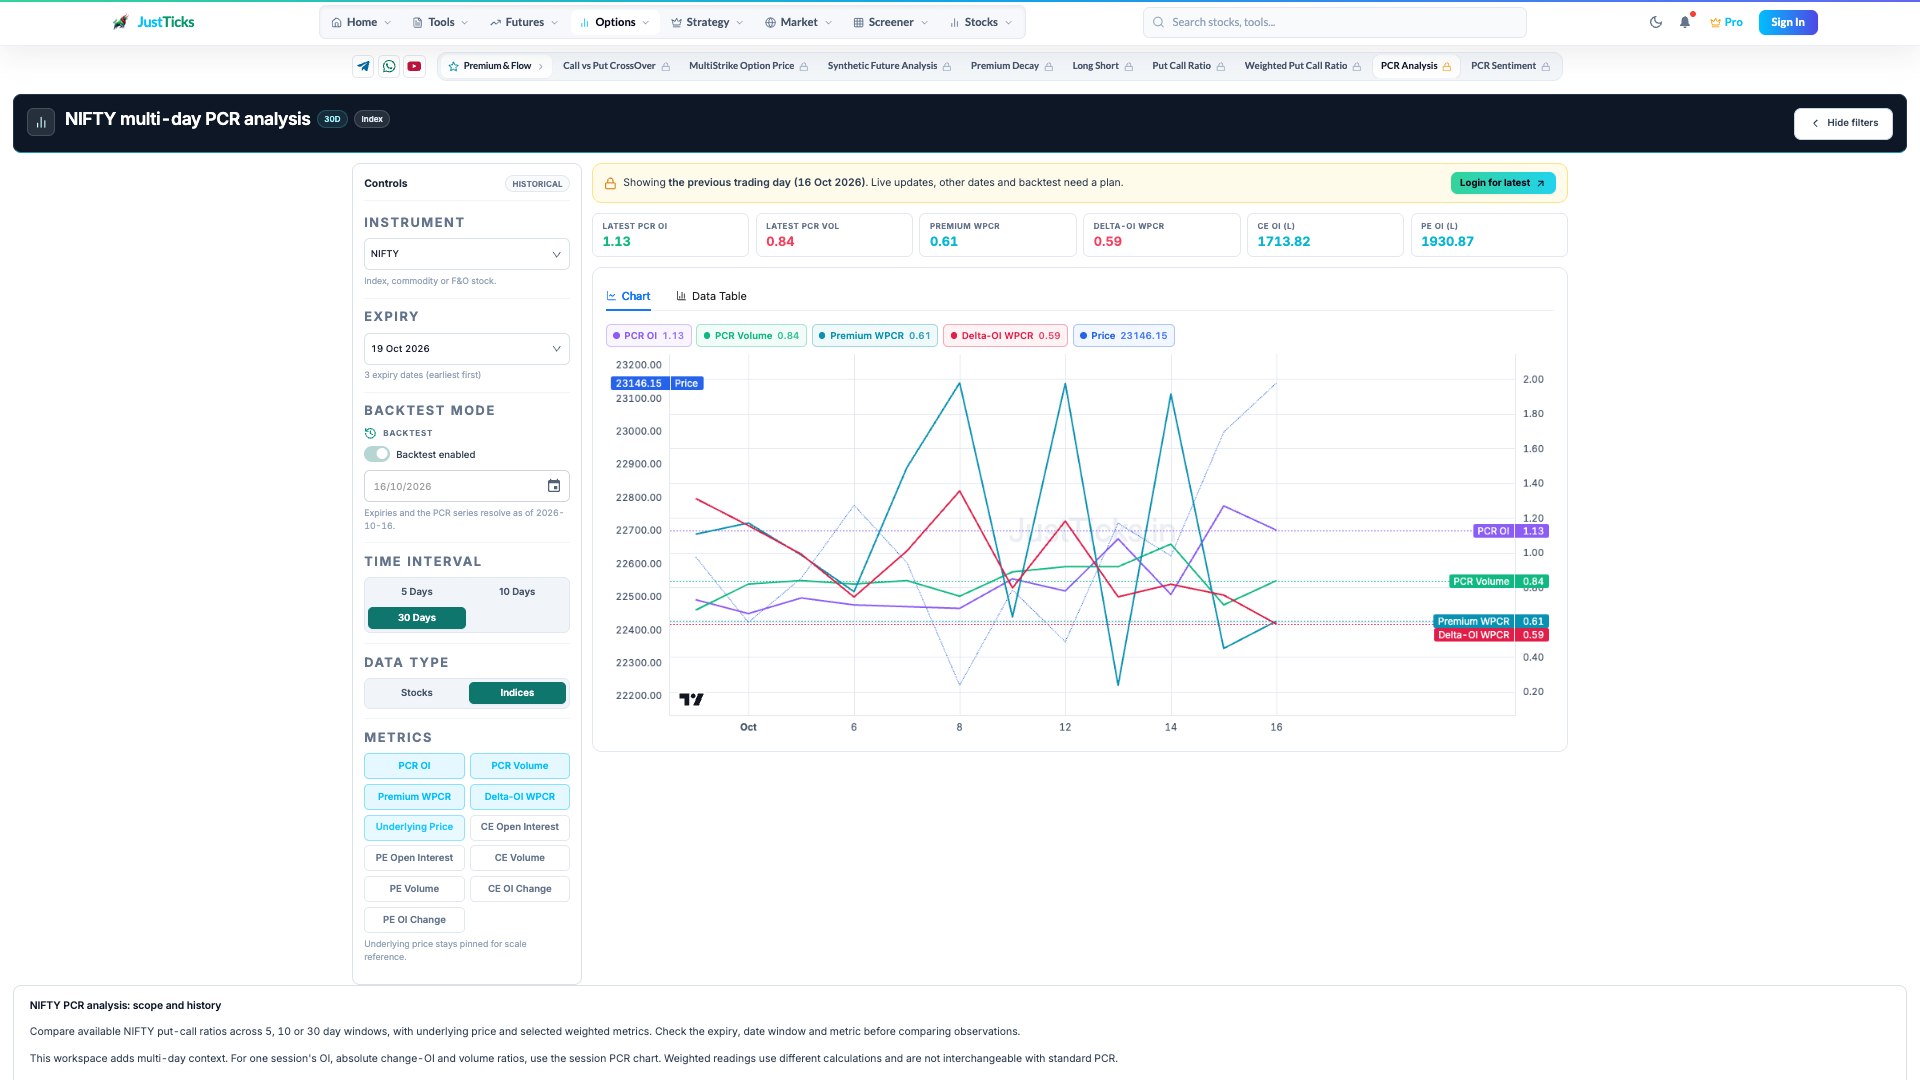
- Expiry and end date. Keep the contract and historical end date comparable across windows.
- History window. The 5, 10 and 30 day controls request available history; they do not guarantee a complete daily sample.
- Current readings. Standard OI and volume ratios differ from premium and delta-weighted measures.
- Metric labels. Use the legend and both scales to distinguish price from each ratio.
Set up a comparable historical view
- Open the instrument page and its filters. Select the underlying and expiry before the date window.
- Choose 5 Days, 10 Days or 30 Days. If using a historical end date, verify that the expiry and available series resolve for that date.
- Start with OI PCR and price. Add volume PCR, then one weighted measure so each comparison has a clear purpose.
- Switch to the data table to inspect the observation date and value behind a line segment. Missing dates should remain missing rather than being read as zero.
- Repeat with another window while keeping expiry and metric fixed. A different scale or number of observations can change the apparent shape.
Worked example: a changing denominator
Suppose put OI is 12 million and call OI is 10 million: OI PCR is 1.20. On the next observation put OI is still 12 million while call OI falls to 8 million: PCR becomes 1.50. The increase did not require any new put OI. Inspect the chain totals before assigning a cause to a rising ratio.
These are illustrative figures. If the selected expiry changes between the observations, the comparison also changes the contract group; that is different from a continuous change within one expiry.
History and measurement limits
A high reading relative to the visible window is not a calibrated probability of reversal. Different expiries, strike coverage, missing deltas and small call-side denominators can alter comparisons. A historical chart is descriptive and does not identify who initiated the trades.
Use the weighted PCR guide for the weighting formulas and the session walkthrough for one-day chart controls.