
Build a basket first
Everything on the page depends on the strikes you choose. The strike focus control starts from ATM or a nearby range, and you can pick individual strikes, save the basket for the symbol and clear it to return to ATM. Choose liquid strikes around ATM and keep the basket stable while you compare times. Adding many distant strikes crowds the chart and dilutes the current structure, and mixing illiquid contracts can hide the rotation the chart is meant to show.
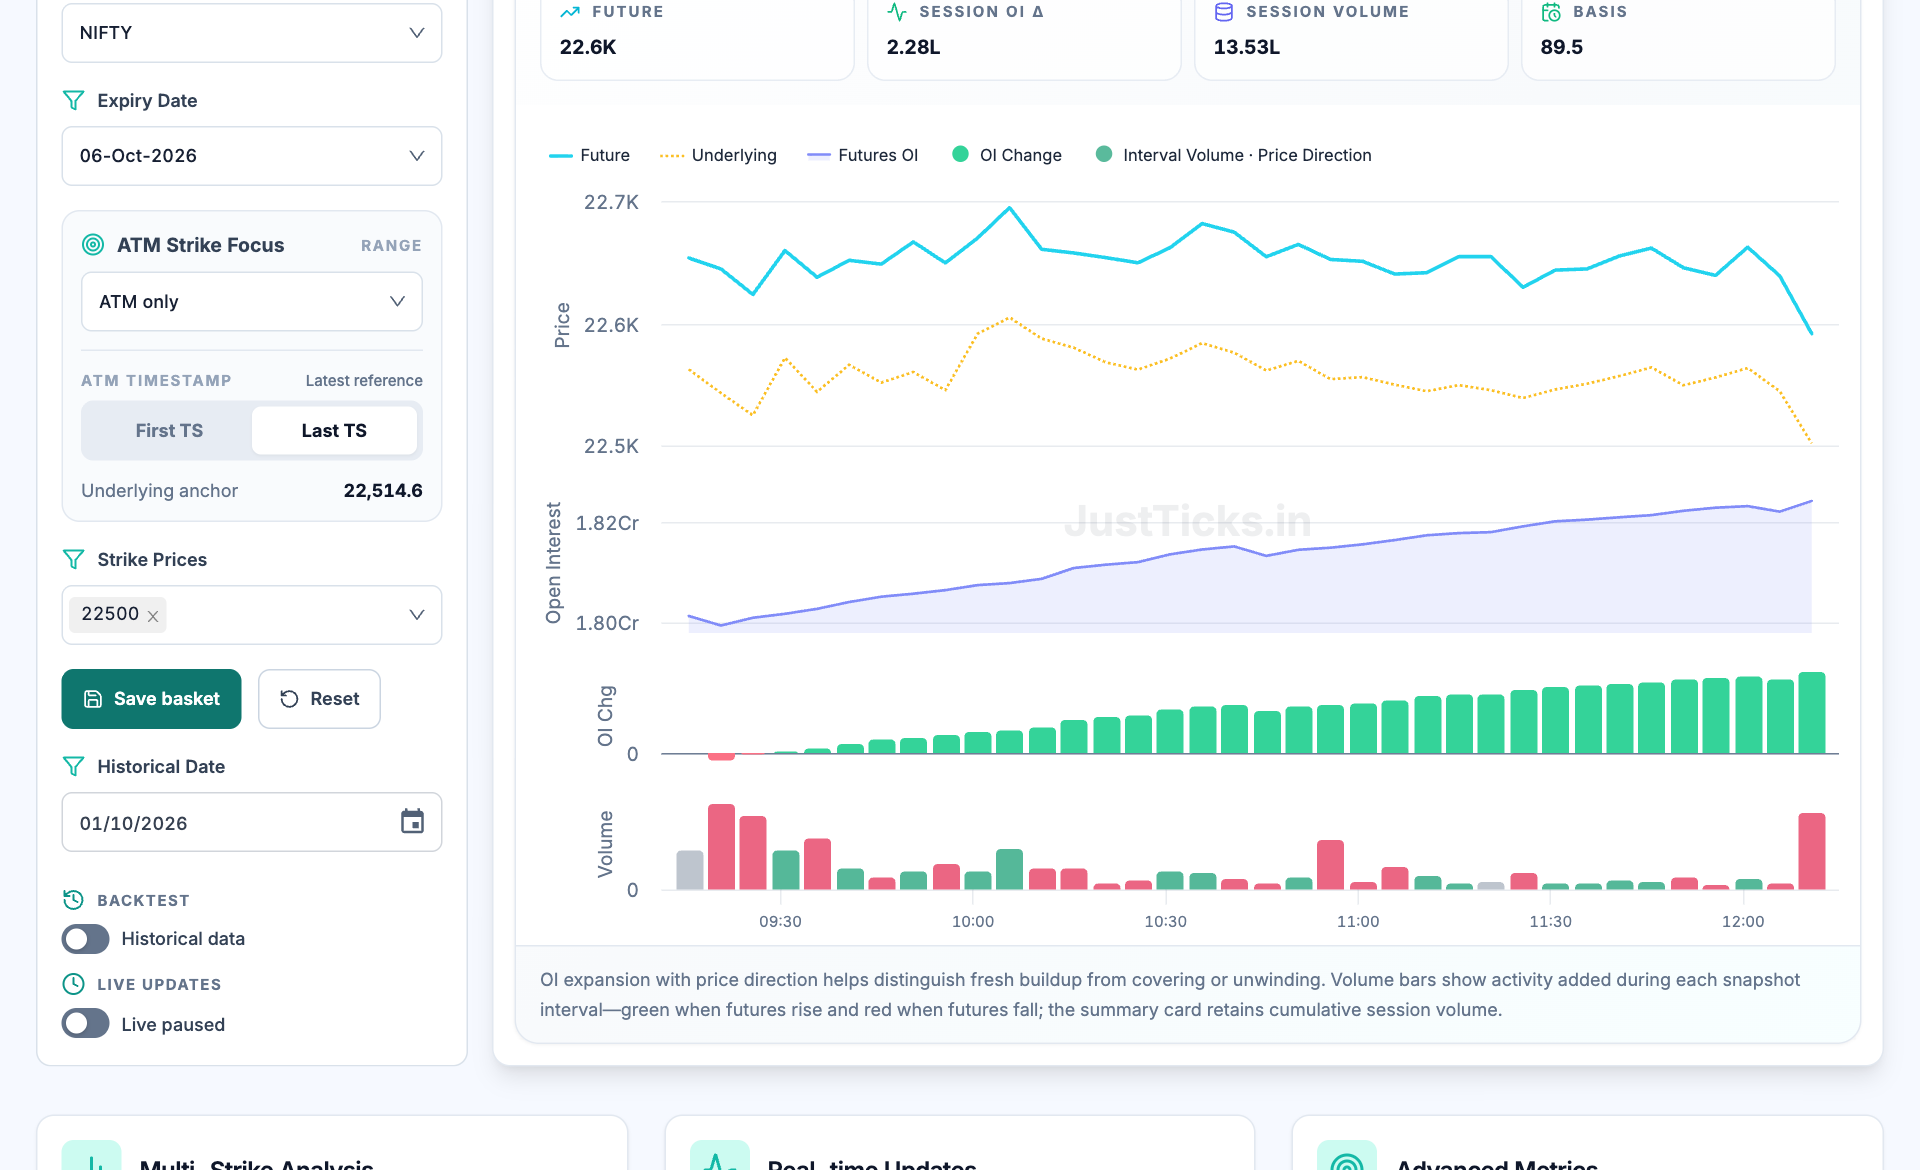
- Anchor on ATM. Strike focus starts from the at-the-money strike or a nearby range, using either the first or the last timestamp as the reference.
- Strike basket. Pick the strikes to compare, then save the basket for this symbol or reset it to return to ATM.
- Futures aligned to the session. A futures panel shows price, futures OI and OI change for the contract aligned to this options session.
- Volume by interval. Volume bars show activity added in each snapshot interval: green when futures rise and red when they fall.
What you can plot
| Analysis | What it shows | How to use it |
|---|---|---|
| OI overall | Total call and total put open interest at each selected strike. | Where positions sit. Compare strikes to see which side leads. |
| OI change | Fresh expansion or contraction rather than the outstanding level. | Where positions are being added or removed now. |
| Volume | Traded call and put activity across the basket. | Whether activity is concentrated or spread. |
| PCR and imbalance | Volume-based put-call ratio and a normalised call-put volume imbalance. | Whether the same lean appears at adjacent strikes and across snapshots. |
Keep the same definition while you compare. Mixing OI, OI change and volume in one reading is a common source of confusion; change one thing at a time, and use the same strikes and expiry when testing whether a pattern persists.
Reading migration
Strike migration is when OI or volume leadership moves from one selected strike to another. Ask whether the new leader is nearer to spot, farther away or tied to an expiry roll. In fast index moves the ATM strike shifts, and a previously important strike can become quiet. Round strikes and weekly expiries often show visible rotation in NIFTY and BANKNIFTY.
Migration shows activity relocating, but the cause may be defence, speculation, hedging, closing or rolling. It does not prove that the same traders moved their positions.
A comparison routine
- Choose the symbol, expiry and a basket of five to seven liquid strikes around ATM.
- Start with OI change, which answers what is happening now, and then look at OI overall for context.
- Add volume and check whether it agrees with the OI change at the same strikes.
- Look for the same imbalance across adjacent strikes and several snapshots before treating it as real.
- Note which strike gains or loses activity as spot moves, then confirm in the option chain or Call vs Put OI.
Limits
Strikes move differently because moneyness, liquidity, implied volatility, hedging demand and participant positioning differ between them. Ratios from thin strikes, especially in stock options, can be unstable, so check absolute OI and volume as well as the ratio. Distinguish changes in the selected basket from changes in the contracts themselves, and compare price and implied volatility before interpreting a shift.