
The highest call and put OI strikes
The strike with the most call open interest is commonly called the call wall; the strike with the most put open interest is the put wall. Traders watch these as positioning reference levels. Every open contract has both a long and a short side, so OI concentration alone does not prove that a strike will act as support or resistance.
Walls move through the expiry cycle as positions are added, closed and rolled, so the table reports the current highest-OI strike on each side and the open interest sitting there.
How to use the Option Writer Scanner
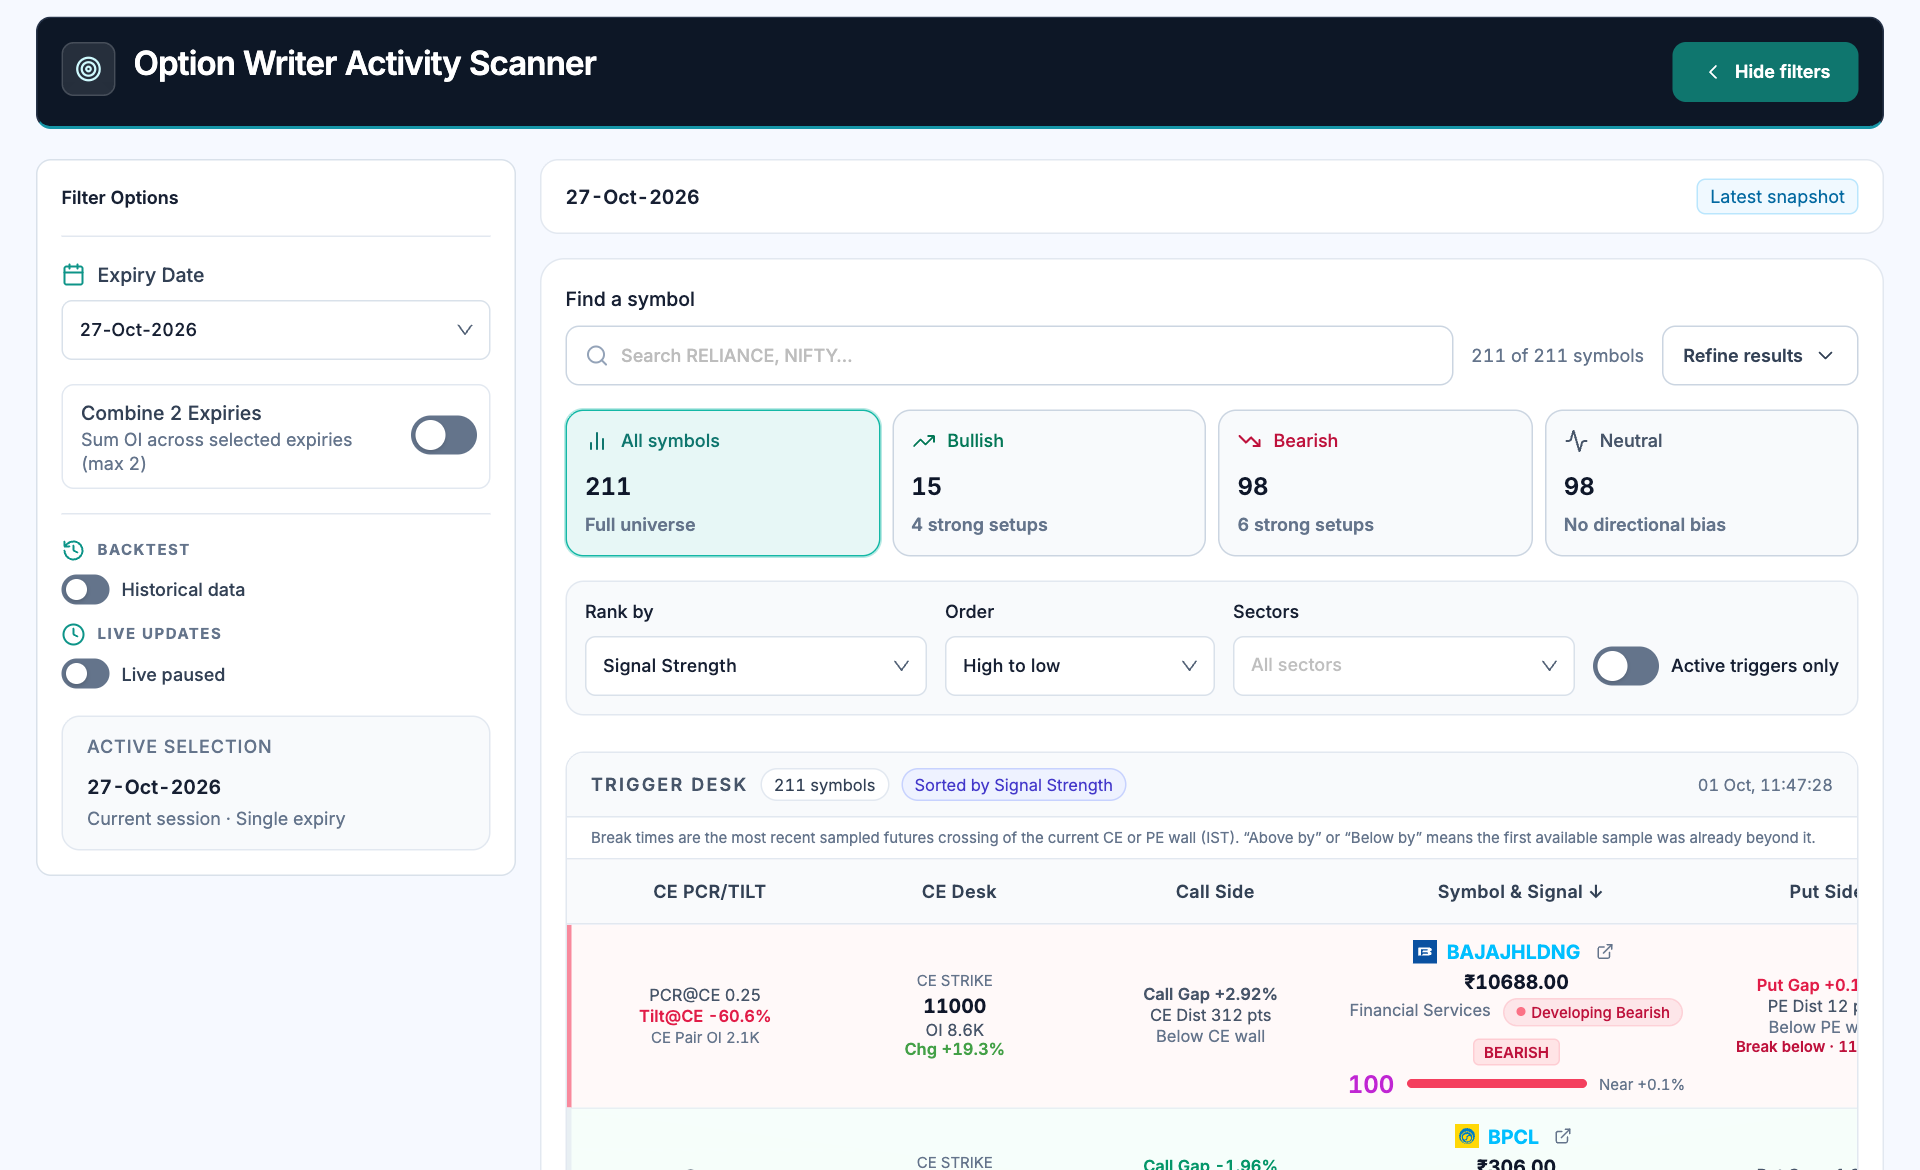
- Choose the contract scope. The expiry and combine toggle determine the OI totals being compared.
- Read the filtered universe. Directional counts describe this selected contract universe.
- Rank and refine. Signal strength, sector and active-trigger filters change the displayed shortlist.
- Inspect the wall inputs. Read strike, OI and OI change together before interpreting a wall label.
- Open Option Writer Scanner, select the expiry and decide whether to combine available expiries.
- Check the snapshot time and choose a symbol or sector.
- Read the highest call and put OI strikes, the price gap to each wall and their OI changes.
- Use active-trigger filters to review qualifying boundary interactions, then open the underlying chart.
- Compare a wall's strike PCR with whole-chain PCR separately; their denominators differ.
Building versus unwinding
The OI change at a wall is shown as a percentage of the strike's current open interest. A negative number means writers are closing positions at that wall; a positive number means fresh writing. Falling call OI while price rises through the call wall, or falling put OI while price falls through the put wall, is the pattern the scanner tiers as Explosive, Strong, Moderate or Developing.
- Explosive: price beyond the wall and wall OI down more than 10%.
- Strong: wall OI down 5% to 10%.
- Moderate: wall OI down by less than 5%.
- Developing: price beyond the wall but OI still building or flat.
Distance to the wall
The gap column shows how far price is from each wall as a percentage and in points, and whether price is above, below or at the wall. For stocks that have already crossed, the break column shows the most recent sampled futures crossing time in IST; if the first sample was already beyond the wall it reads 'above by' or 'below by' that time instead.
The Active triggers filter keeps stocks that have crossed a wall with writers unwinding, or sit within about 2% of a wall with writers unwinding.
PCR and tilt at a strike
PCR at the strike compares put open interest with call open interest at the wall's strike. Tilt expresses the same comparison as a share of the strike's total open interest: positive means puts dominate, negative means calls dominate. Both describe positioning at that one strike rather than the whole chain.
Limits and common misreads
- A wall is not a guarantee. Price can pass through or stall short of a wall for reasons unrelated to option positioning.
- OI does not show who is long or short on the other side, so unwinding can reflect rolls to another expiry rather than conviction.
- Liquidity matters. Small absolute OI produces large percentages.
- Snapshots refresh every five minutes, so the table shows positioning as of the last update.
Cross-check with price action and volume. Nothing here is investment advice.