
What is an option writer trap?
A call writer trap forms when a stock's price closes above the strike with the highest call open interest. Call writers there are short a right that is now in the money, so they face rising losses and often buy back or roll their calls. A put writer trap is the mirror image: price closes below the strike with the highest put open interest, so put writers are under pressure.
The trap describes where writers stand relative to price. It does not say what price will do next; it only records that a widely watched level has been crossed and how the people defending it are behaving.
How to use the Option Trap Indicator
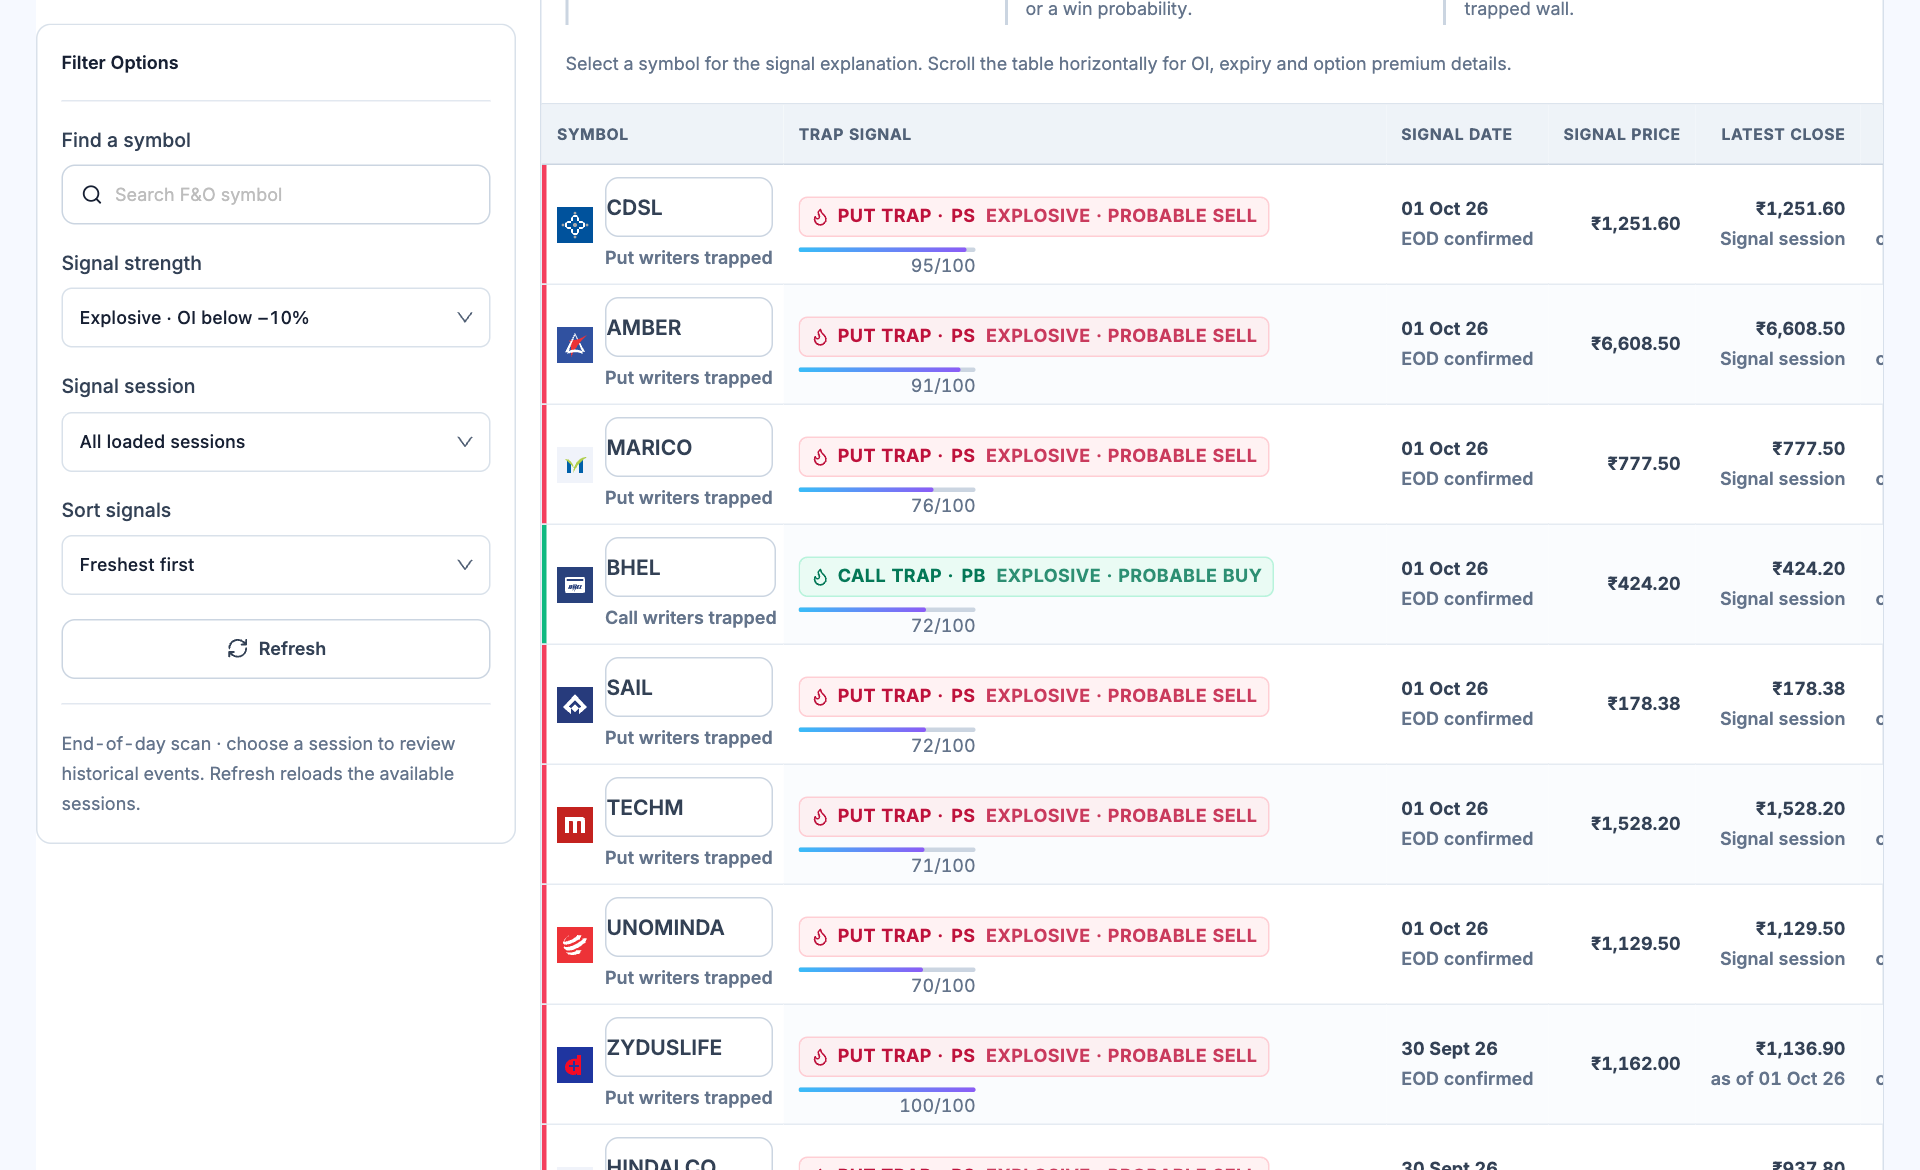
- Filter unwinding strength. The tier reflects the OI change at the trapped strike.
- Choose the signal session. Historical events retain their original signal date.
- Identify the side. Call and put traps label which wall was crossed, rather than guaranteeing the next move.
- Separate signal and latest prices. Price movement after a signal is an underlying-price observation, not option P&L.
- Open Option Trap Indicator and choose a session or review all loaded sessions.
- Filter the unwinding tier and sort by freshness or strength.
- Select a symbol to inspect the trapped wall, expiry and OI explanation.
- Compare the original signal price with later close and any lifecycle-ended label.
- Check the chain and price chart; OI measures outstanding contracts and does not reveal every participant's motive.
How unwinding tiers are set
The scanner measures the change in open interest at the trapped strike as a percentage of the strike's current open interest. A falling number means writers are closing positions.
| Tier | OI change at the trapped strike | Reading |
|---|---|---|
| Explosive | Below -10% | Writers are leaving the wall quickly |
| Strong | -10% to -5% | Clear unwinding |
| Moderate | -5% to 0% | Mild unwinding |
| Developing | 0% or higher | Price crossed the wall but writers are still adding or holding |
The 0-100 strength score starts at 50 and adds twice the percentage of OI that left the strike, capped at 100. It ranks unwinding intensity and is not a probability.
Which expiry is used
Each session uses that day's nearest valid, non-expired contract, so an old signal is never judged against a contract that did not exist yet. The scan looks back over the latest 15 trading sessions and uses end-of-day snapshots.
Signal lifecycle: PB, PS and PE
The indicator labels a call trap PB and a put trap PS as short codes for the price direction they describe. If a later close returns to or crosses the original wall before expiry, the event is relabelled PE, which marks the end of that signal's lifecycle. The underlying move column shows how far price travelled from the signal close to the first wall re-entry, expiry or latest close, adjusted so a positive number means movement in the signal's direction.
That percentage is a measure of the underlying, not option profit and loss, and it is not a win rate: open and completed events cover different observation periods, and one stock can trigger on several dates.
Limits and common misreads
- End-of-day data. Intraday crossings that reverse before the close are not captured.
- One strike, not the whole chain. The wall is the single highest-OI strike; spreads and hedged positions can make writer behaviour look different from what the OI suggests.
- Open interest change is reported with a lag and can include new positions and closures that offset.
- Illiquid stocks can show large percentages from small absolute OI.
Check price structure, volume and liquidity before drawing any conclusion. Nothing here is investment advice.