
How Bollinger Bands are built
Bollinger Bands have three lines: a basis, normally a 20-period simple moving average, and an upper and lower band set a fixed number of standard deviations (commonly 2) above and below it. Because standard deviation measures recent price dispersion, the bands widen when volatility rises and narrow when it falls.
The bands do not predict direction and carry no fixed probability that price stays inside them. They describe price relative to its own recent behaviour.
Screenshot: controls and readings
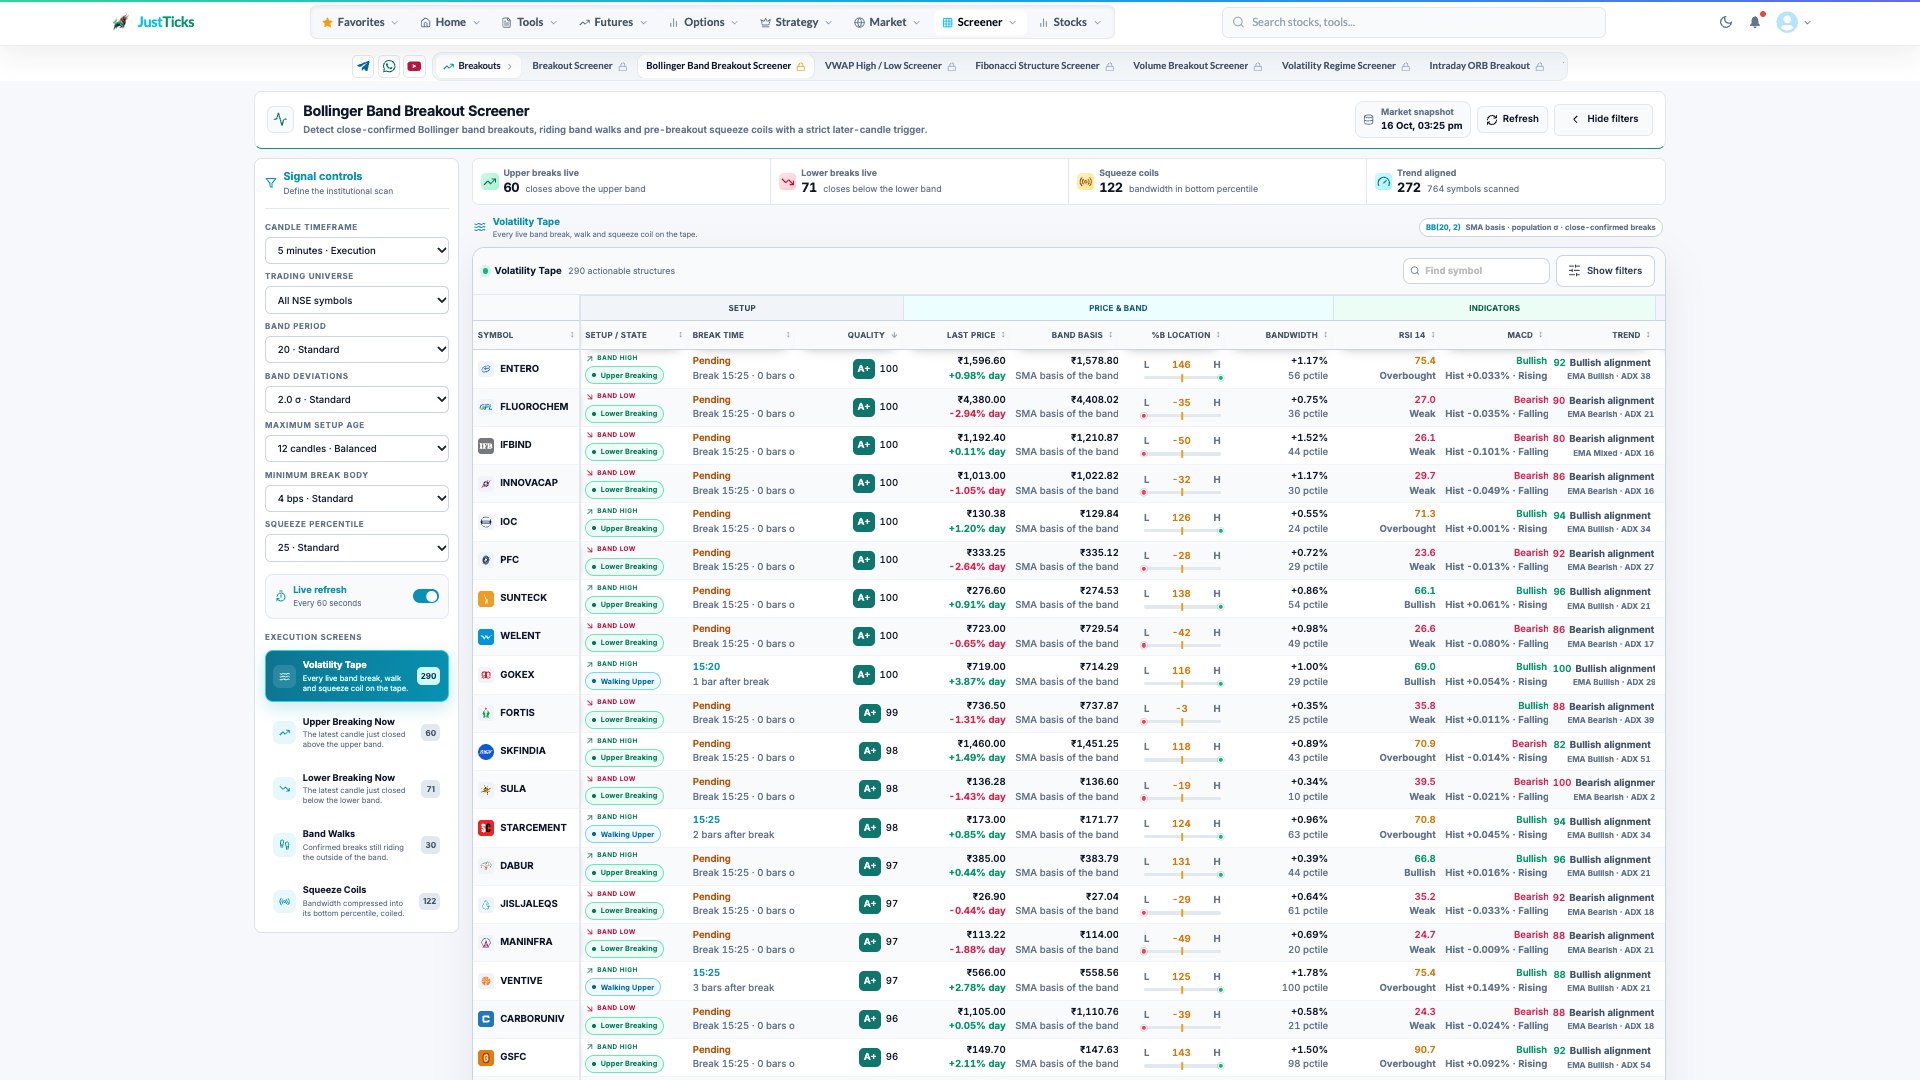
- Band period. The lookback changes the moving average and the distribution used for the bands.
- Band deviations. Keep the deviation multiplier fixed when comparing band breaks.
- Band location. %B locates price within or beyond the bands; it is not a probability.
- Bandwidth. Read compression relative to the displayed historical percentile, alongside the setup state.
How to use the Bollinger Band Breakout Screener
- Open the Bollinger Band Breakout Screener, choose the timeframe and session, and start with Volatility Tape.
- Use Squeeze Coils for compressed bandwidth, Upper/Lower Breaking Now for fresh outside closes, or Band Walks for continuation.
- Read %B as location relative to the bands and bandwidth as the width of the envelope.
- Check the signal candle and later confirmation in the chart. A band break and a completed reversal are different conditions.
- Review participation and invalidation before interpreting a high score; low bandwidth does not choose the next direction.
The two numbers that matter: %B and bandwidth
| Measure | What it tells you | Reading |
|---|---|---|
| %B | Where the close sits inside the bands | 0 = lower band, 100 = upper band, above 100 or below 0 = closed outside |
| Bandwidth | Distance between the bands relative to the basis | Low = compressed (squeeze), high = expanded |
| Bandwidth percentile | Today's bandwidth ranked against its own history | Bottom of the range flags a coil |
Three setups
Squeeze coil
Before the moveBandwidth sits near the bottom of its recent range. Volatility tends to mean-revert, so compression frequently precedes expansion. The squeeze says a move is likely, not which way.
Band break
The triggerA candle closes outside the upper or lower band. A close, not a wick, marks expansion relative to recent history.
Band walk
PersistenceCloses hold at or beyond the band while bandwidth keeps rising. A walk shows a trend that keeps extending instead of snapping back to the basis.
A later candle trading beyond the breakout candle's extreme is what separates a walk from a poke. One-candle breaks that close back inside the band are the most common false signal and usually revert toward the basis.
Building the trade plan
- Prefer breaks that come out of a squeeze; a break from an already wide band has less room.
- Check relative volume: expansion should be backed by participation.
- Place invalidation at a close back inside the band or at the basis, whichever your timeframe supports.
- Take partial profit at a measured multiple of risk and trail the rest along the basis or the opposite side of the setup candle.
A worked example
XYZ coils for 12 sessions with bandwidth in the lowest 10% of its history and the upper band at 252. A candle closes at 255 with %B above 100. The next candle trades above the breakout candle's high of 256.5, turning the break into a walk. Entry 257, invalidation a close back below the basis at 246, so risk is 11.
A 2R target is 257 + 22 = 279. Had the same close happened from an already wide band, there would be less room to run, so the squeeze is what makes this setup attractive.
Illustrative numbers for a hypothetical stock, not a recommendation or a past trade.
Limits of the indicator
- Trending markets keep printing outside-band closes. Treat them as persistence, not as overbought or oversold reversals.
- Settings change the signal. A different period or deviation moves every band; keep them constant when comparing days.
- Illiquid stocks produce noisy bands. One large print can distort the deviation.