
What is a breakout stock?
A breakout stock is one whose price closes beyond a level where sellers (for an upside break) previously stopped it. The level can be a prior swing high, the top of a sideways range, a falling trendline, a chart-pattern boundary or a 52-week high. The idea is that supply at that level has been absorbed, so price can move with less resistance.
A breakdown is the mirror image: a close below support. The same checks apply in reverse.
| Level type | How it forms | What a break suggests |
|---|---|---|
| Horizontal resistance | Two or more rejections at a similar price | Sellers at that price are exhausted |
| Range top | Weeks of sideways trading in a tight band | Consolidation resolving upward |
| Trendline | Lower highs joined by a line | Downtrend pressure easing |
| 52-week high | Highest price of the last year | No overhead supply from trapped holders |
How to use the Breakout Screener
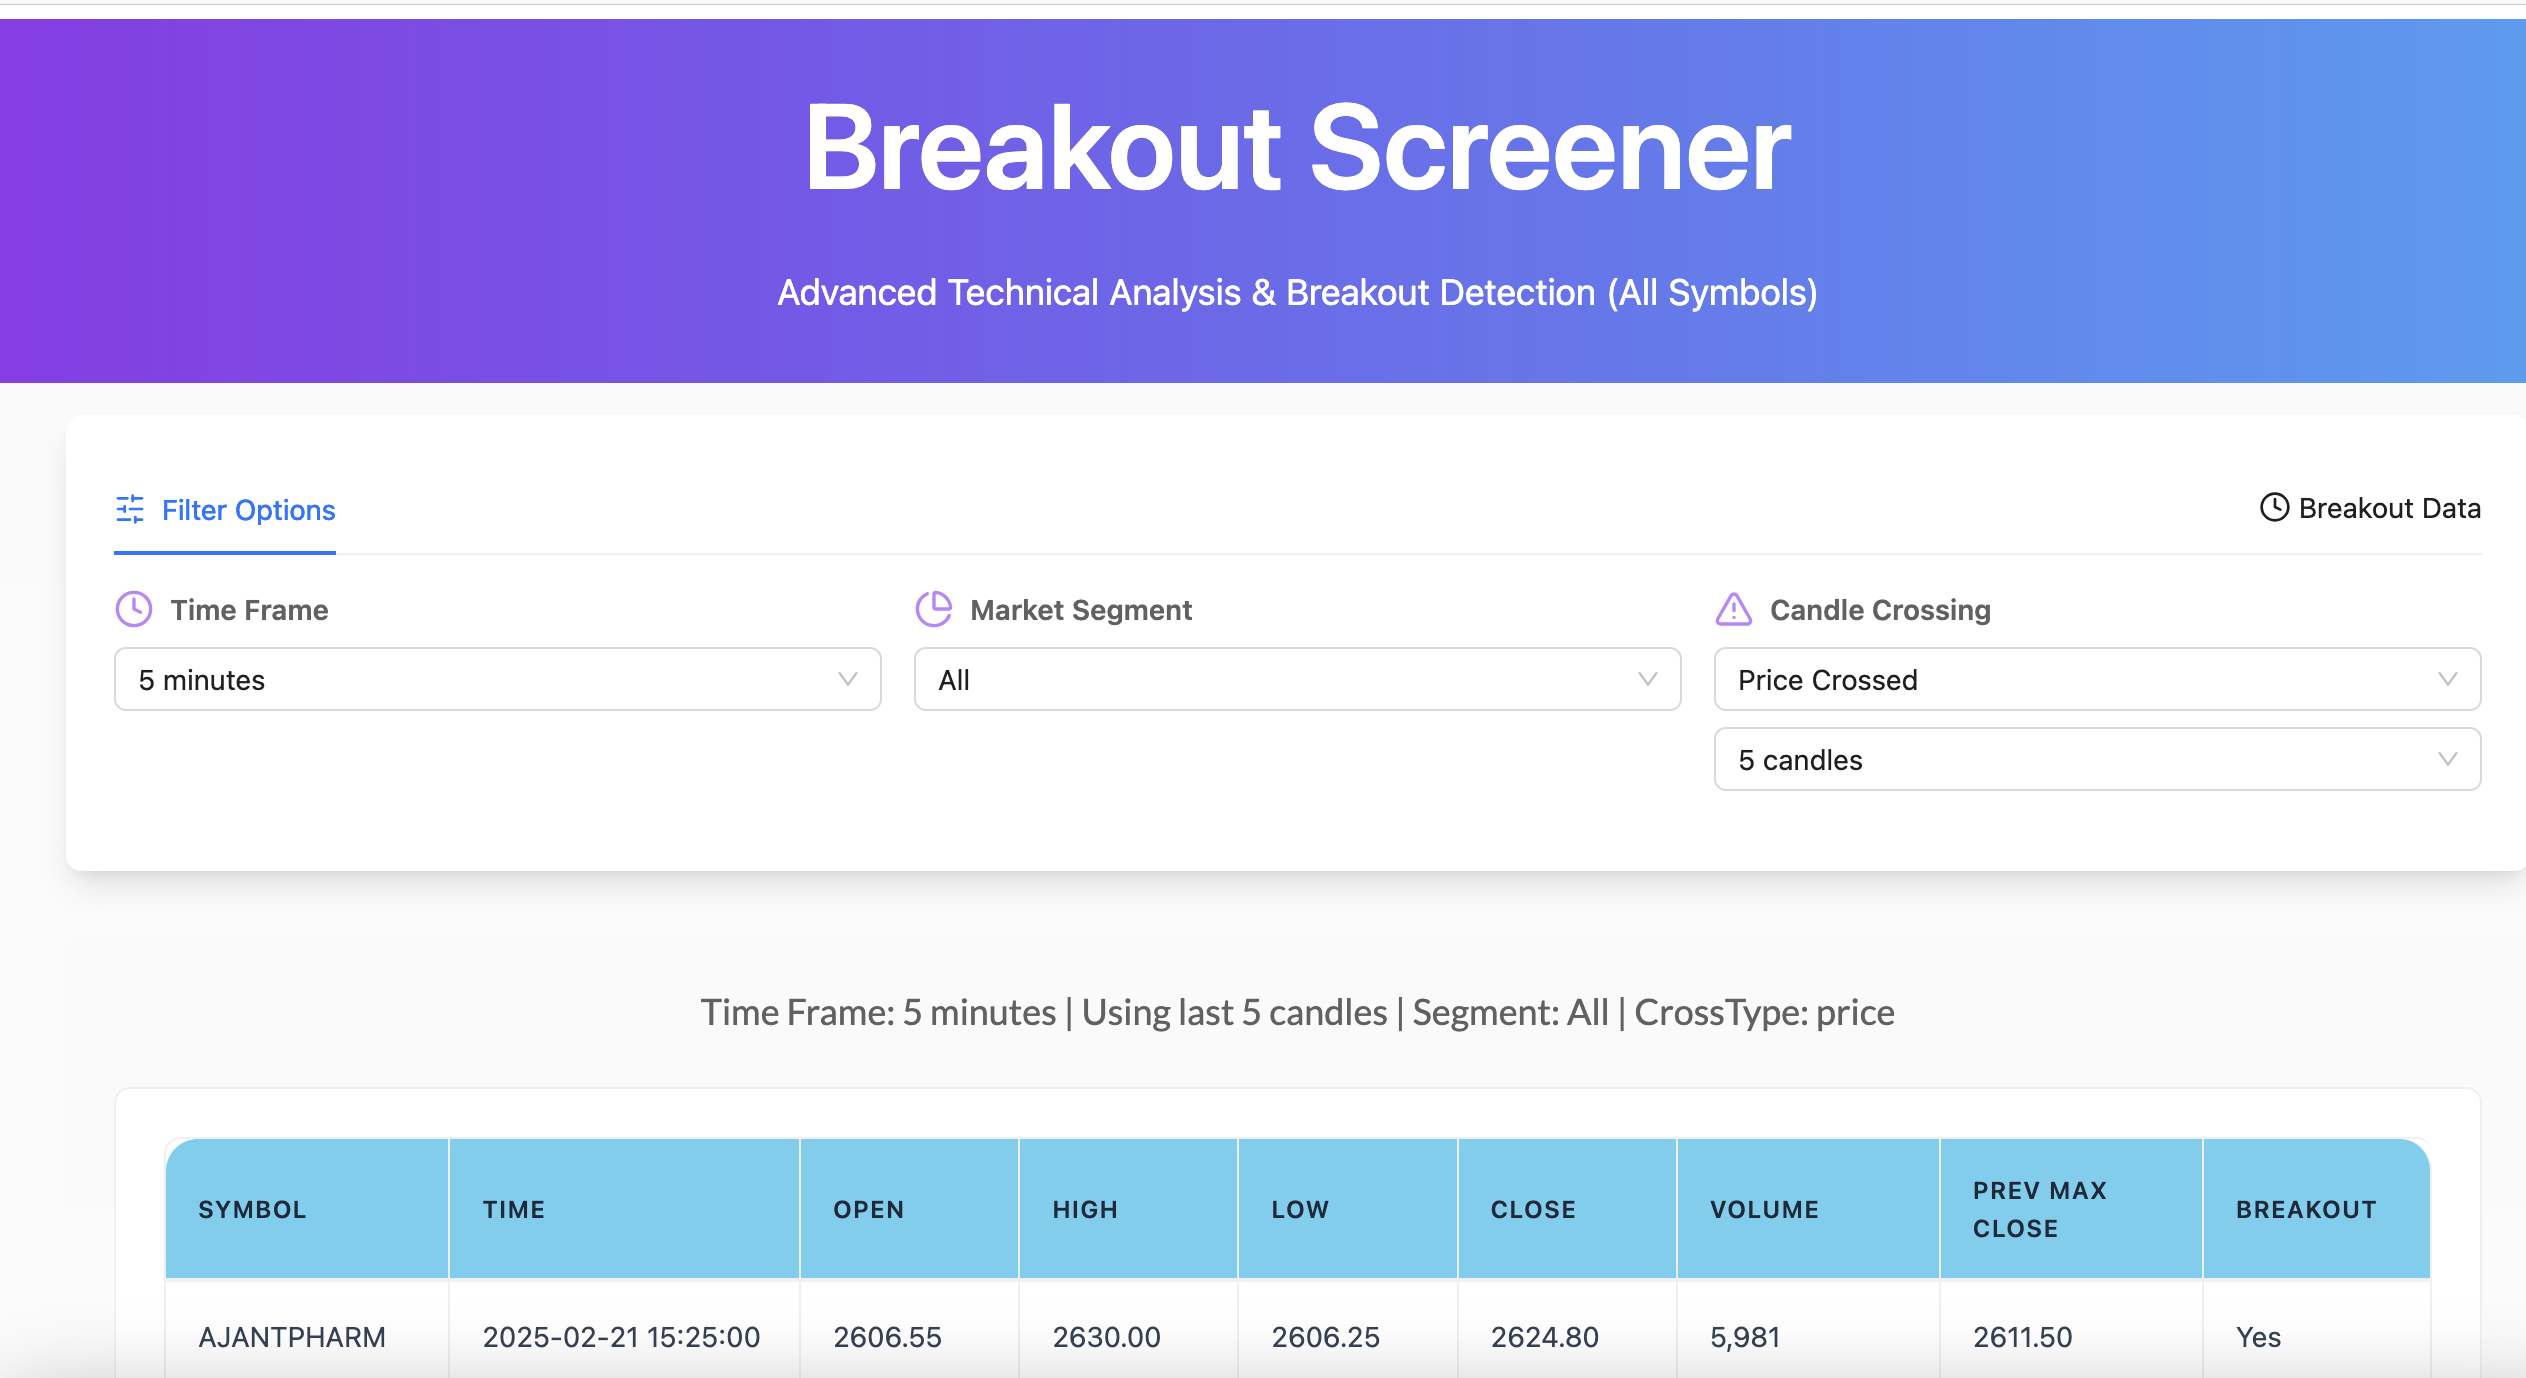
- Choose the candle interval. Timeframe controls the candles being compared; keep it fixed while evaluating a setup.
- Restrict the universe. Market Segment limits the symbols in the scan.
- Define the reference window. Crossing mode and reference-candle count change what qualifies as a breakout.
- Check the level. Compare the close with the reference close rather than relying on the Yes label alone.
- Open the Breakout Screener and choose the timeframe, segment and session.
- Set reference candles and the breakout direction. Price, volume and ATR modes answer different questions.
- Start with the broad scan, then narrow the freshness or participation filters.
- Open a candidate chart and compare the reference level with the signal close. Check whether the latest candle is complete.
- Recheck current price against the level before using an old qualifying row.
Genuine vs false breakout
Most breakouts that fail look fine at the moment of the break. Check these before acting:
| Check | Genuine breakout | False breakout |
|---|---|---|
| Close | Candle closes beyond the level | Only the wick pokes through |
| Volume | Well above the stock's own average | Average or falling volume |
| Base | Tight, several touches, weeks long | Loose, one touch, a few days |
| Extension | Price still close to the level | Already far above it |
| Market | Index and sector supportive | Index weak or reversing |
Volume should be judged against the stock's own history, not in absolute terms: a large-cap and a small-cap carry very different normal volumes.
A repeatable routine
- Pick a timeframe that matches your holding period: 5m or 15m for intraday, 1h or daily for swing trades.
- Shortlist by proximity. Candidates just below or just above the level offer the smallest risk. Stocks several percent beyond it have already made the move.
- Check volume against the baseline. Participation should rise as price reaches the level.
- Define invalidation before entry. For an upside break, a close back below the broken level is the usual line.
- Choose the entry style. Entering on the break gives the earliest fill but more false signals; waiting for a retest of the level gives a cleaner stop at the cost of missing some runs.
- Size from the stop, not the target. Position size = acceptable loss divided by distance to invalidation.
Using a breakout screener
The Breakout Screener lists NSE stocks and indices approaching or crossing their breakout level and ranks them by how close price is to that level, so the best-priced setups lead the list. Filter by timeframe, then open each chart to confirm the level, the volume and the market context. A screener produces a shortlist, not a signal: the chart review is the step that removes weak candidates.
A worked example
XYZ trades between 940 and 1,000 for six weeks and has been rejected at 1,000 three times. It then closes at 1,012 on 2.8x its average volume. Entry 1,012, stop 992 (back inside the range), so risk is 20 per share.
- Risking ₹5,000: 5,000 ÷ 20 = 250 shares. A 2R target is 1,012 + 40 = 1,052.
- Chasing at 1,045 with the same stop risks 53 per share. The same 250 shares would risk ₹13,250, or the position must shrink to about 94 shares.
The only difference between the two entries is distance from the level, which is why proximity is the first sort key.
Illustrative numbers for a hypothetical stock, not a recommendation or a past trade.
Common mistakes
- Chasing extended stocks. Buying far above the level leaves a wide stop and poor reward-to-risk.
- Trading an unfinished candle. A breakout during the session can close back inside the range.
- Ignoring gaps. A gap above the level may leave no practical entry price.
- Skipping liquidity. Thin stocks slip badly on both entry and stop.
- Ignoring the index. Breakouts in a falling market fail more often.