
Relative volume, not absolute volume
A stock trading 50 lakh shares can be quiet or explosive, depending on what it normally trades. Relative volume compares the current volume with the stock's own average for the same period, so a 5x reading means five times its usual activity.
That is why a volume multiple is the key filter: it removes the bias toward large, always-liquid names and surfaces real changes in interest.
How to use the Volume Breakout Screener
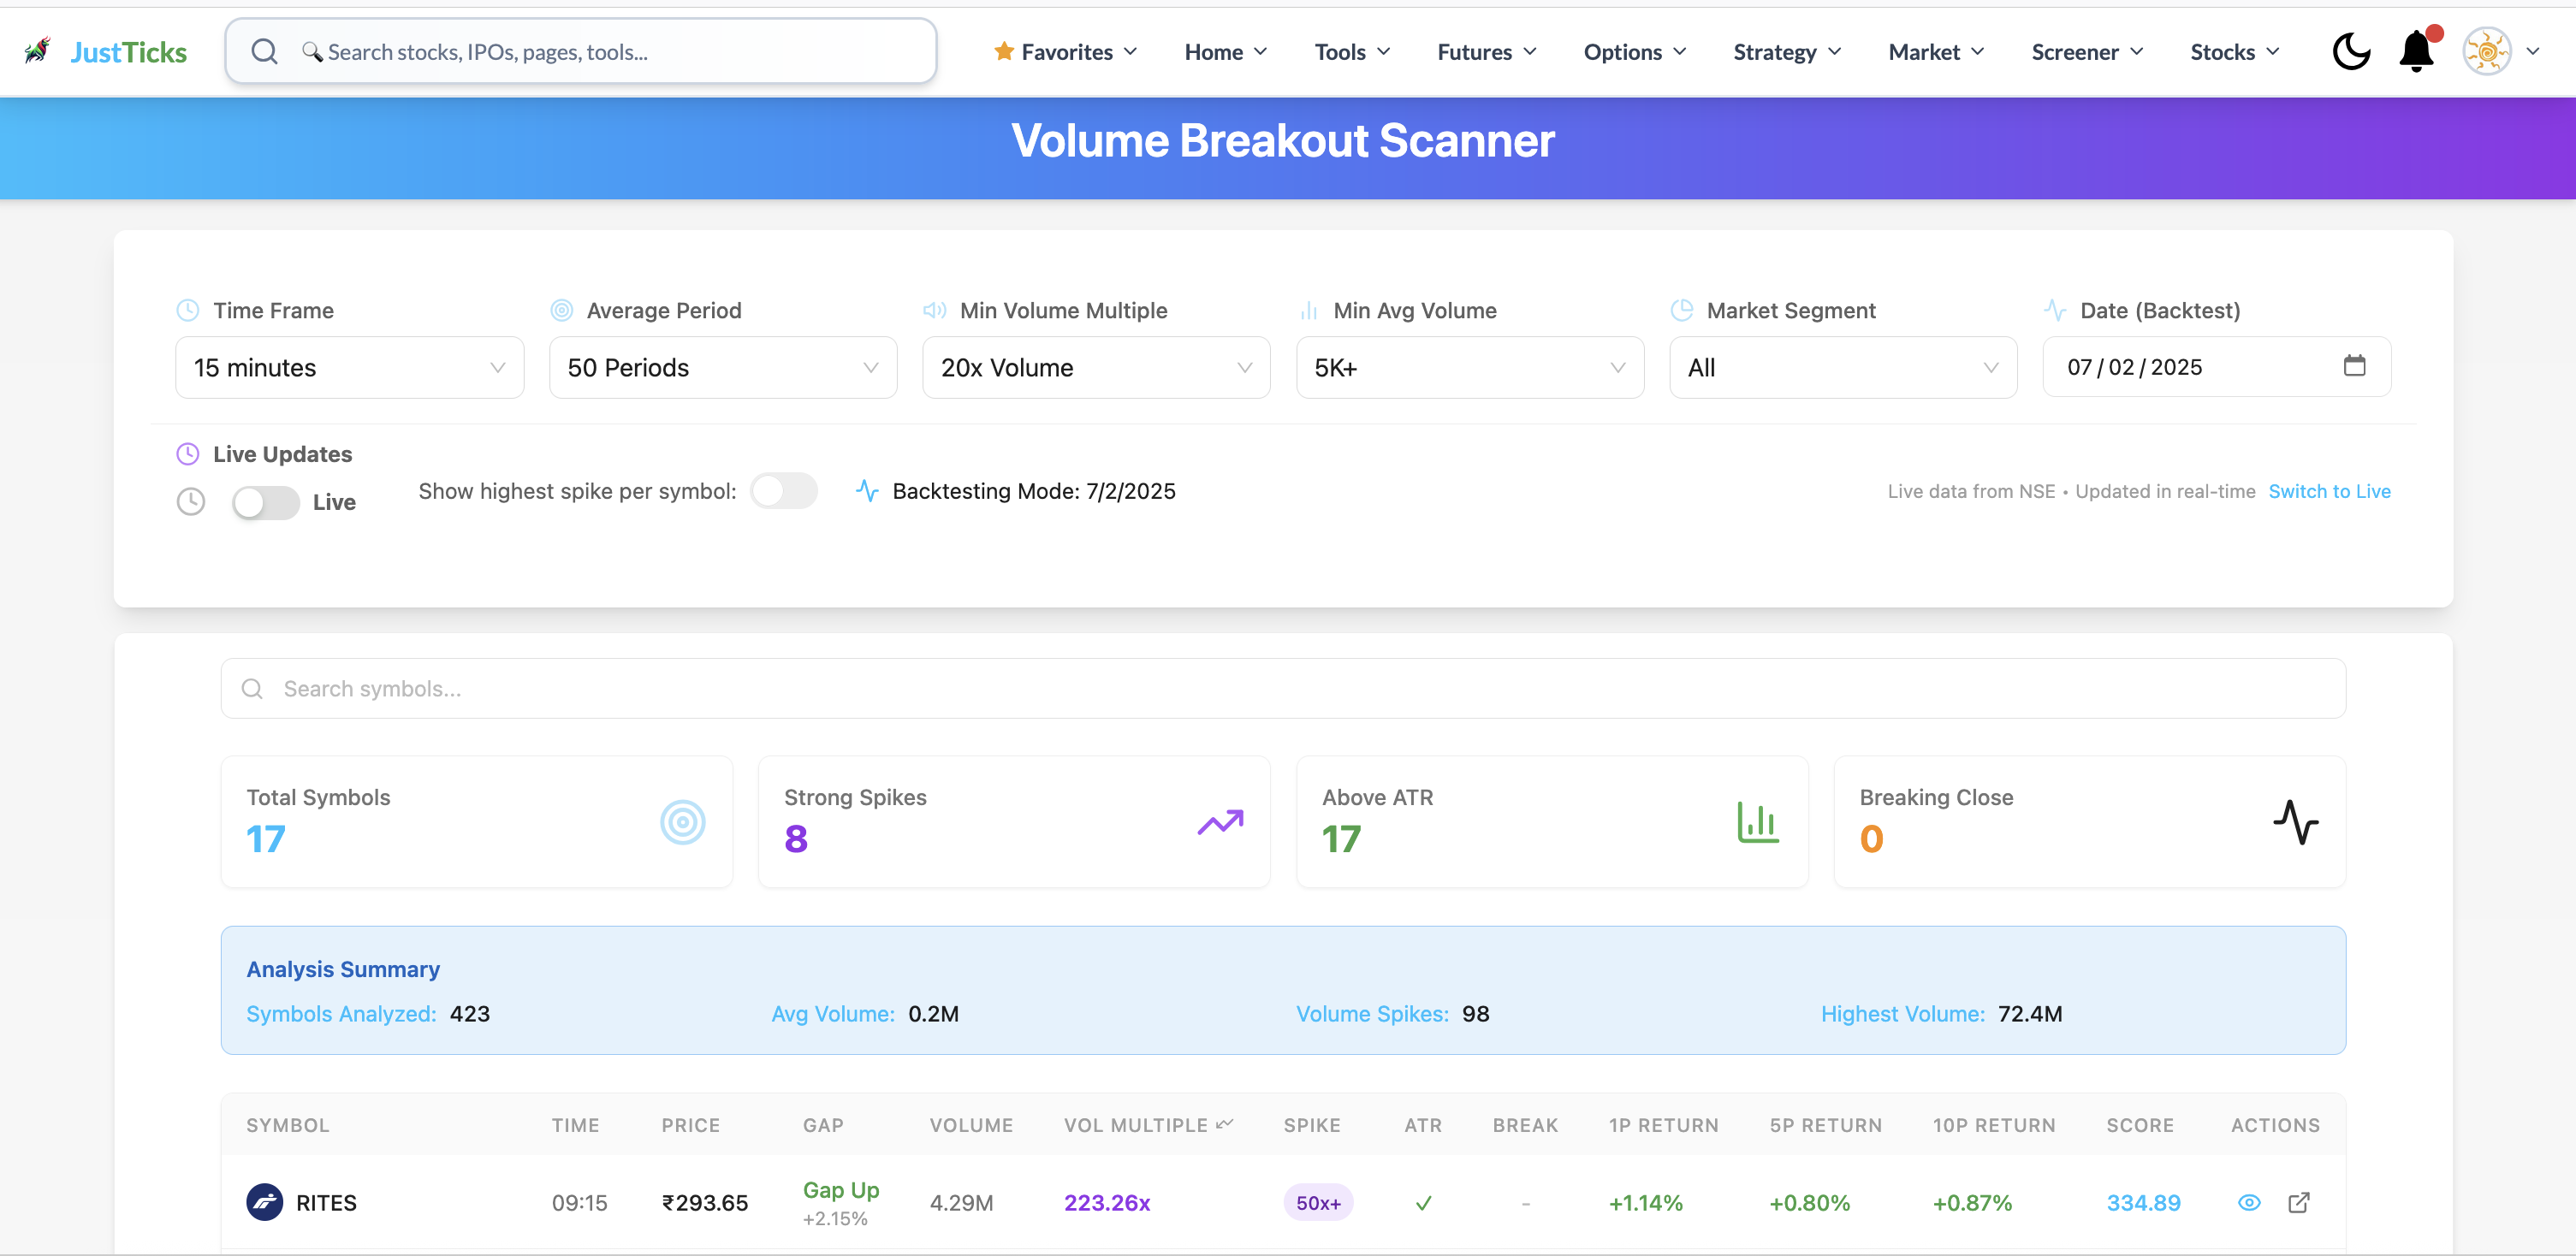
- Set the baseline. The averaging period determines normal volume for each symbol.
- Choose the multiple. The minimum multiple filters the ratio of observed volume to its baseline.
- Confirm the session. The backtest date fixes the observation period; it is separate from live updates.
- Inspect relative volume. A large multiple is participation relative to that symbol, not a forecast of direction.
- Choose the candle timeframe and averaging period in Volume Breakout.
- Set minimum volume and minimum volume multiple to avoid tiny-baseline anomalies.
- Choose live data or a historical date and check the timestamp on the qualifying row.
- Compare the multiple with absolute volume, price change and the ATR/break columns.
- Open the symbol chart to check where the volume occurred; a spike can accompany either buying or selling.
Reading the volume multiple
| Multiple | Typical meaning | How to use it |
|---|---|---|
| 2x to 5x | Elevated interest | Broad screening; verify with price |
| 5x to 20x | Strong participation, often institutional | Primary working range for breakout scans |
| 20x and above | Event-driven (results, news, block deals) | Check the news before trading the move |
Higher multiples mean stronger conviction but fewer names, and extreme readings are often one-off events rather than a tradable trend.
Price confirmation and ATR
Volume alone is not a signal. Pair it with price: the spike should come with a close near the high of the candle for an upside move, and the move should exceed what is normal for the stock.
Average True Range (ATR) measures a stock's normal candle range. A move that is larger than its ATR on high volume points to a genuine expansion, while a high-volume candle that stays inside the normal range is mostly churn.
- Volume up, price up, strong close: participation behind buyers.
- Volume up, price flat: absorption; a break may follow in either direction.
- Volume up, price down, weak close: distribution or panic.
A worked example
XYZ normally trades about 40,000 shares by 10:30. Today it has traded 2,00,000, a 5x relative volume. It is up 3.2% and the latest 15-minute candle closed near its high with a range of 14 against an ATR of 6.
The candle is 2.3 times the stock's normal range (14 ÷ 6) with five times the usual volume: price and participation agree. Had the same volume come with a candle inside its normal range, it would be churn, not a breakout.
Illustrative numbers for a hypothetical stock, not a recommendation or a past trade.
Pitfalls
- Corporate events and index rebalancing create volume with no directional meaning.
- Thin baselines inflate multiples; a stock with a tiny average can show 50x on a modest order.
- Repeated candles from one stock can crowd a list. Keeping only the strongest spike per symbol gives a cleaner view.
- Cash vs F&O. F&O stocks carry derivatives liquidity; cash-only names can gap and slip more.