
The structure
The pole
ImpulseA sharp, high-volume move in one direction. Without a clear pole there is no flag.
The flag
Rectangular pauseParallel trendlines sloping gently against the pole. A bull flag drifts down or sideways; a bear flag drifts up or sideways.
The pennant
Triangular pauseConverging trendlines that squeeze price into a small triangle after the pole.
Both patterns describe the same idea: the move pauses to digest, then continues. Flags are rectangular; pennants converge.
How to use the Flag & Pennants Screener
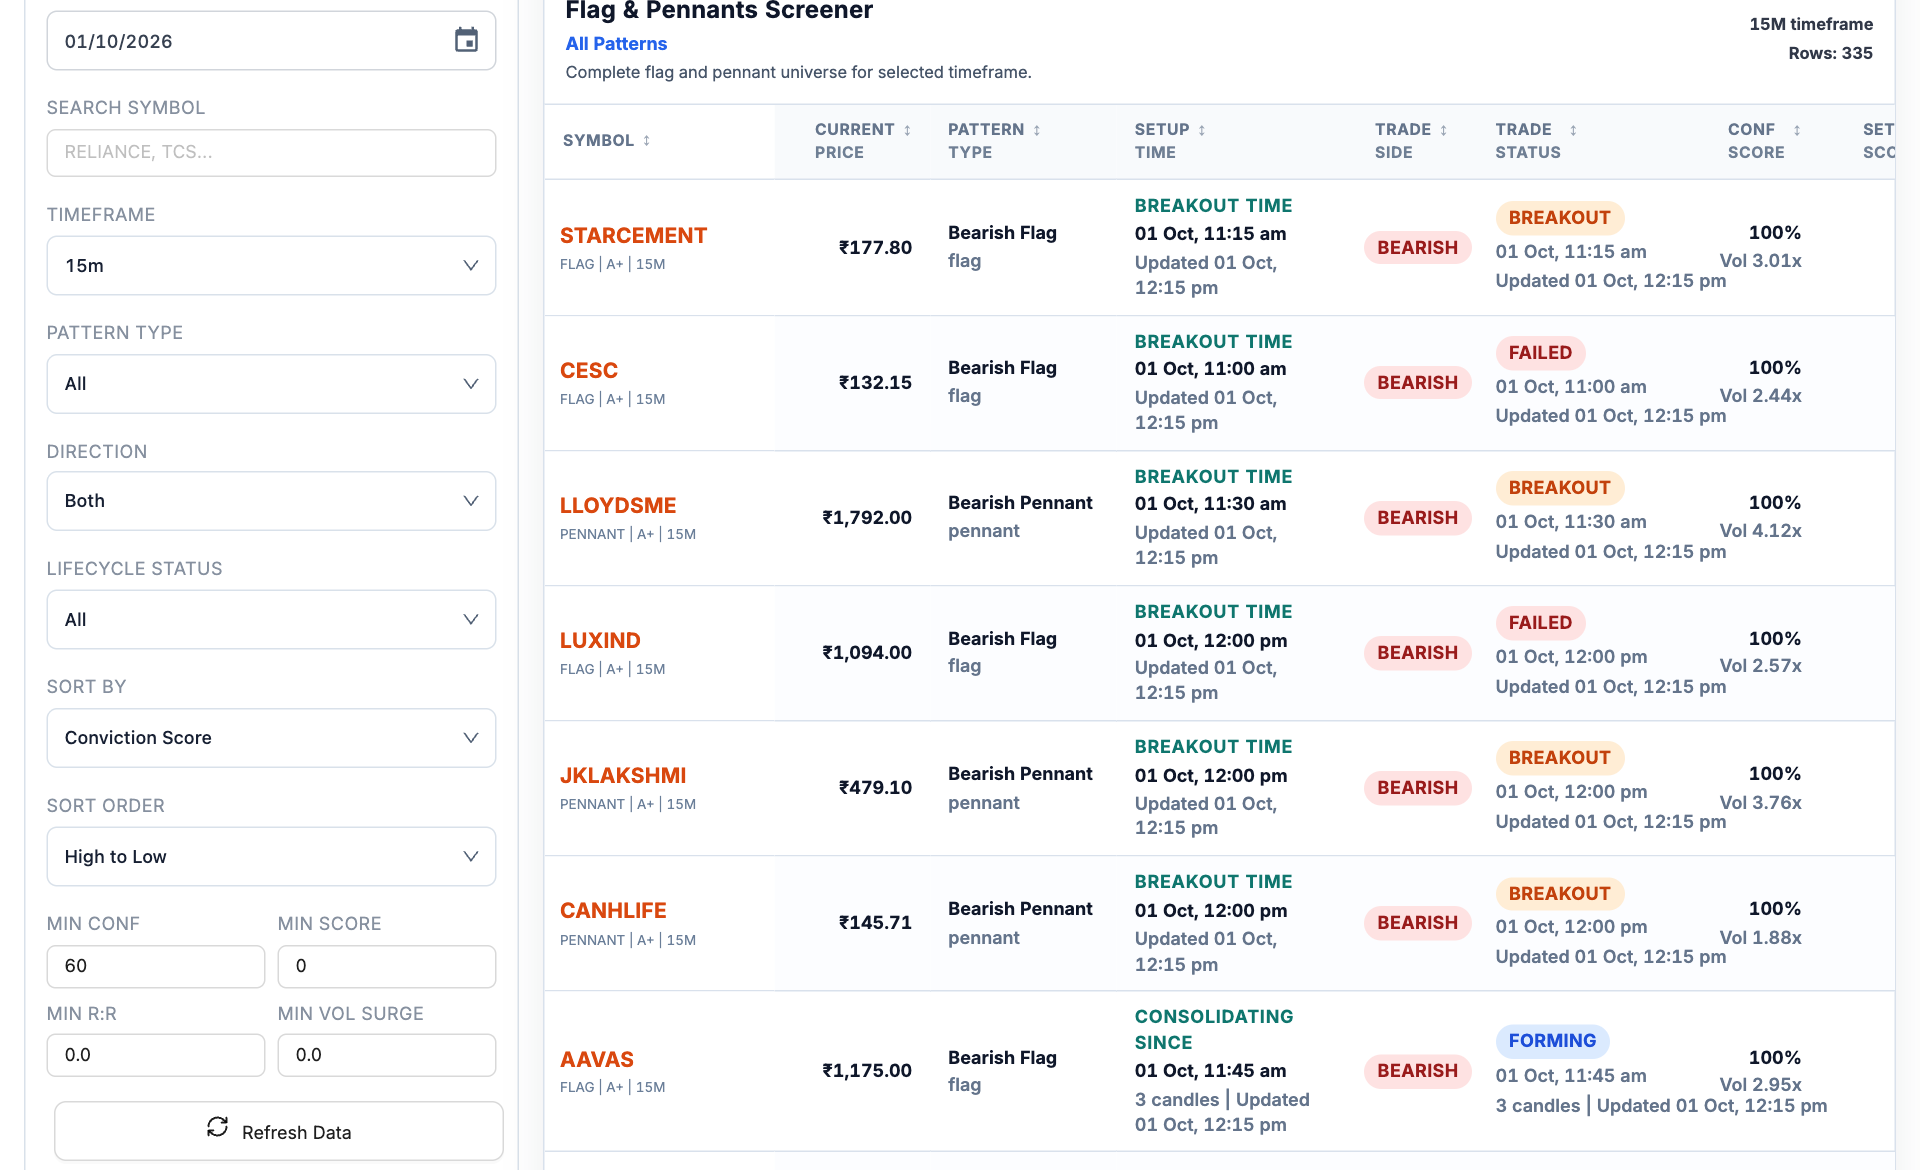
- Choose the pattern family. Flags and pennants have different consolidation shapes.
- Choose lifecycle status. Forming, breakout and failed rows refer to different stages.
- Read failures as well as breaks. A detected pattern can fail; the current status is more useful than the shape alone.
- Check participation. The conviction score and volume multiple are diagnostics, not a win rate.
- Open Flag & Pennants, choose the session and timeframe.
- Select pattern type and direction, then separate forming structures from breakouts.
- Read setup time, updated time and current lifecycle status.
- Compare volume surge and geometry with the chart, including the prior impulse.
- Use failed examples to learn invalidation rather than judging the scanner only by rows still breaking out.
The volume signature
Volume should be high during the pole, fall during the consolidation and expand on the breakout. Rising volume inside the flag suggests the pause is turning into distribution and the pattern is more likely to fail.
Trading it
- Identify the pole and the boundaries on the timeframe you trade.
- Separate forming from breakout. A forming setup belongs on a watchlist; a breakout shows price closing beyond the boundary.
- Enter on the breakout close, or on a retest of the broken boundary that holds.
- Stop goes back inside the pattern, usually below the flag's low for a bull flag.
- Target is often the pole's length added to the breakout point, called the measured move. Treat it as a reference, not a promise.
A worked example
XYZ rises from 400 to 460 in six days (pole of 60) on heavy volume, then drifts to 440 over five days on falling volume. The flag's upper trendline is at 457; a candle closes at 459. Stop below the flag low at 439 (risk 20).
Measured move: 457 + 60 = 517, a reward of about 58, near 2.9R (58 ÷ 20). Reaching the full measured move is not guaranteed, so many traders take partial profit earlier.
Illustrative numbers for a hypothetical stock, not a recommendation or a past trade.
Why they fail
- Consolidation too long or too deep. A flag that retraces more than about half of the pole is no longer a shallow pause.
- Pattern edge decays. A breakout that comes long after the pattern formed has often lost momentum.
- Market reversal. Continuation patterns fail when the index turns against the move.
- Subjective drawing. Different traders draw different boundaries; rely on a consistent rule.