
Why new highs matter
When a stock trades at a 52-week high, every holder from the past year is in profit, so there is little overhead supply from people waiting to "get out at break-even". That absence of resistance, together with the attention a new high attracts, is why trend followers favour these stocks. Research on price momentum has repeatedly noted that stocks near their highs can continue to outperform, though no outcome is guaranteed.
| Check | Healthy | Extended |
|---|---|---|
| Base before the break | Weeks of tight consolidation | Straight-line run with no pause |
| Distance above the old high | A few percent | Well beyond a normal range |
| Volume | Expands on the break | Falls as price rises |
| Market | Index trending up | Index weakening |
How to use the 52 Week High Low Screener
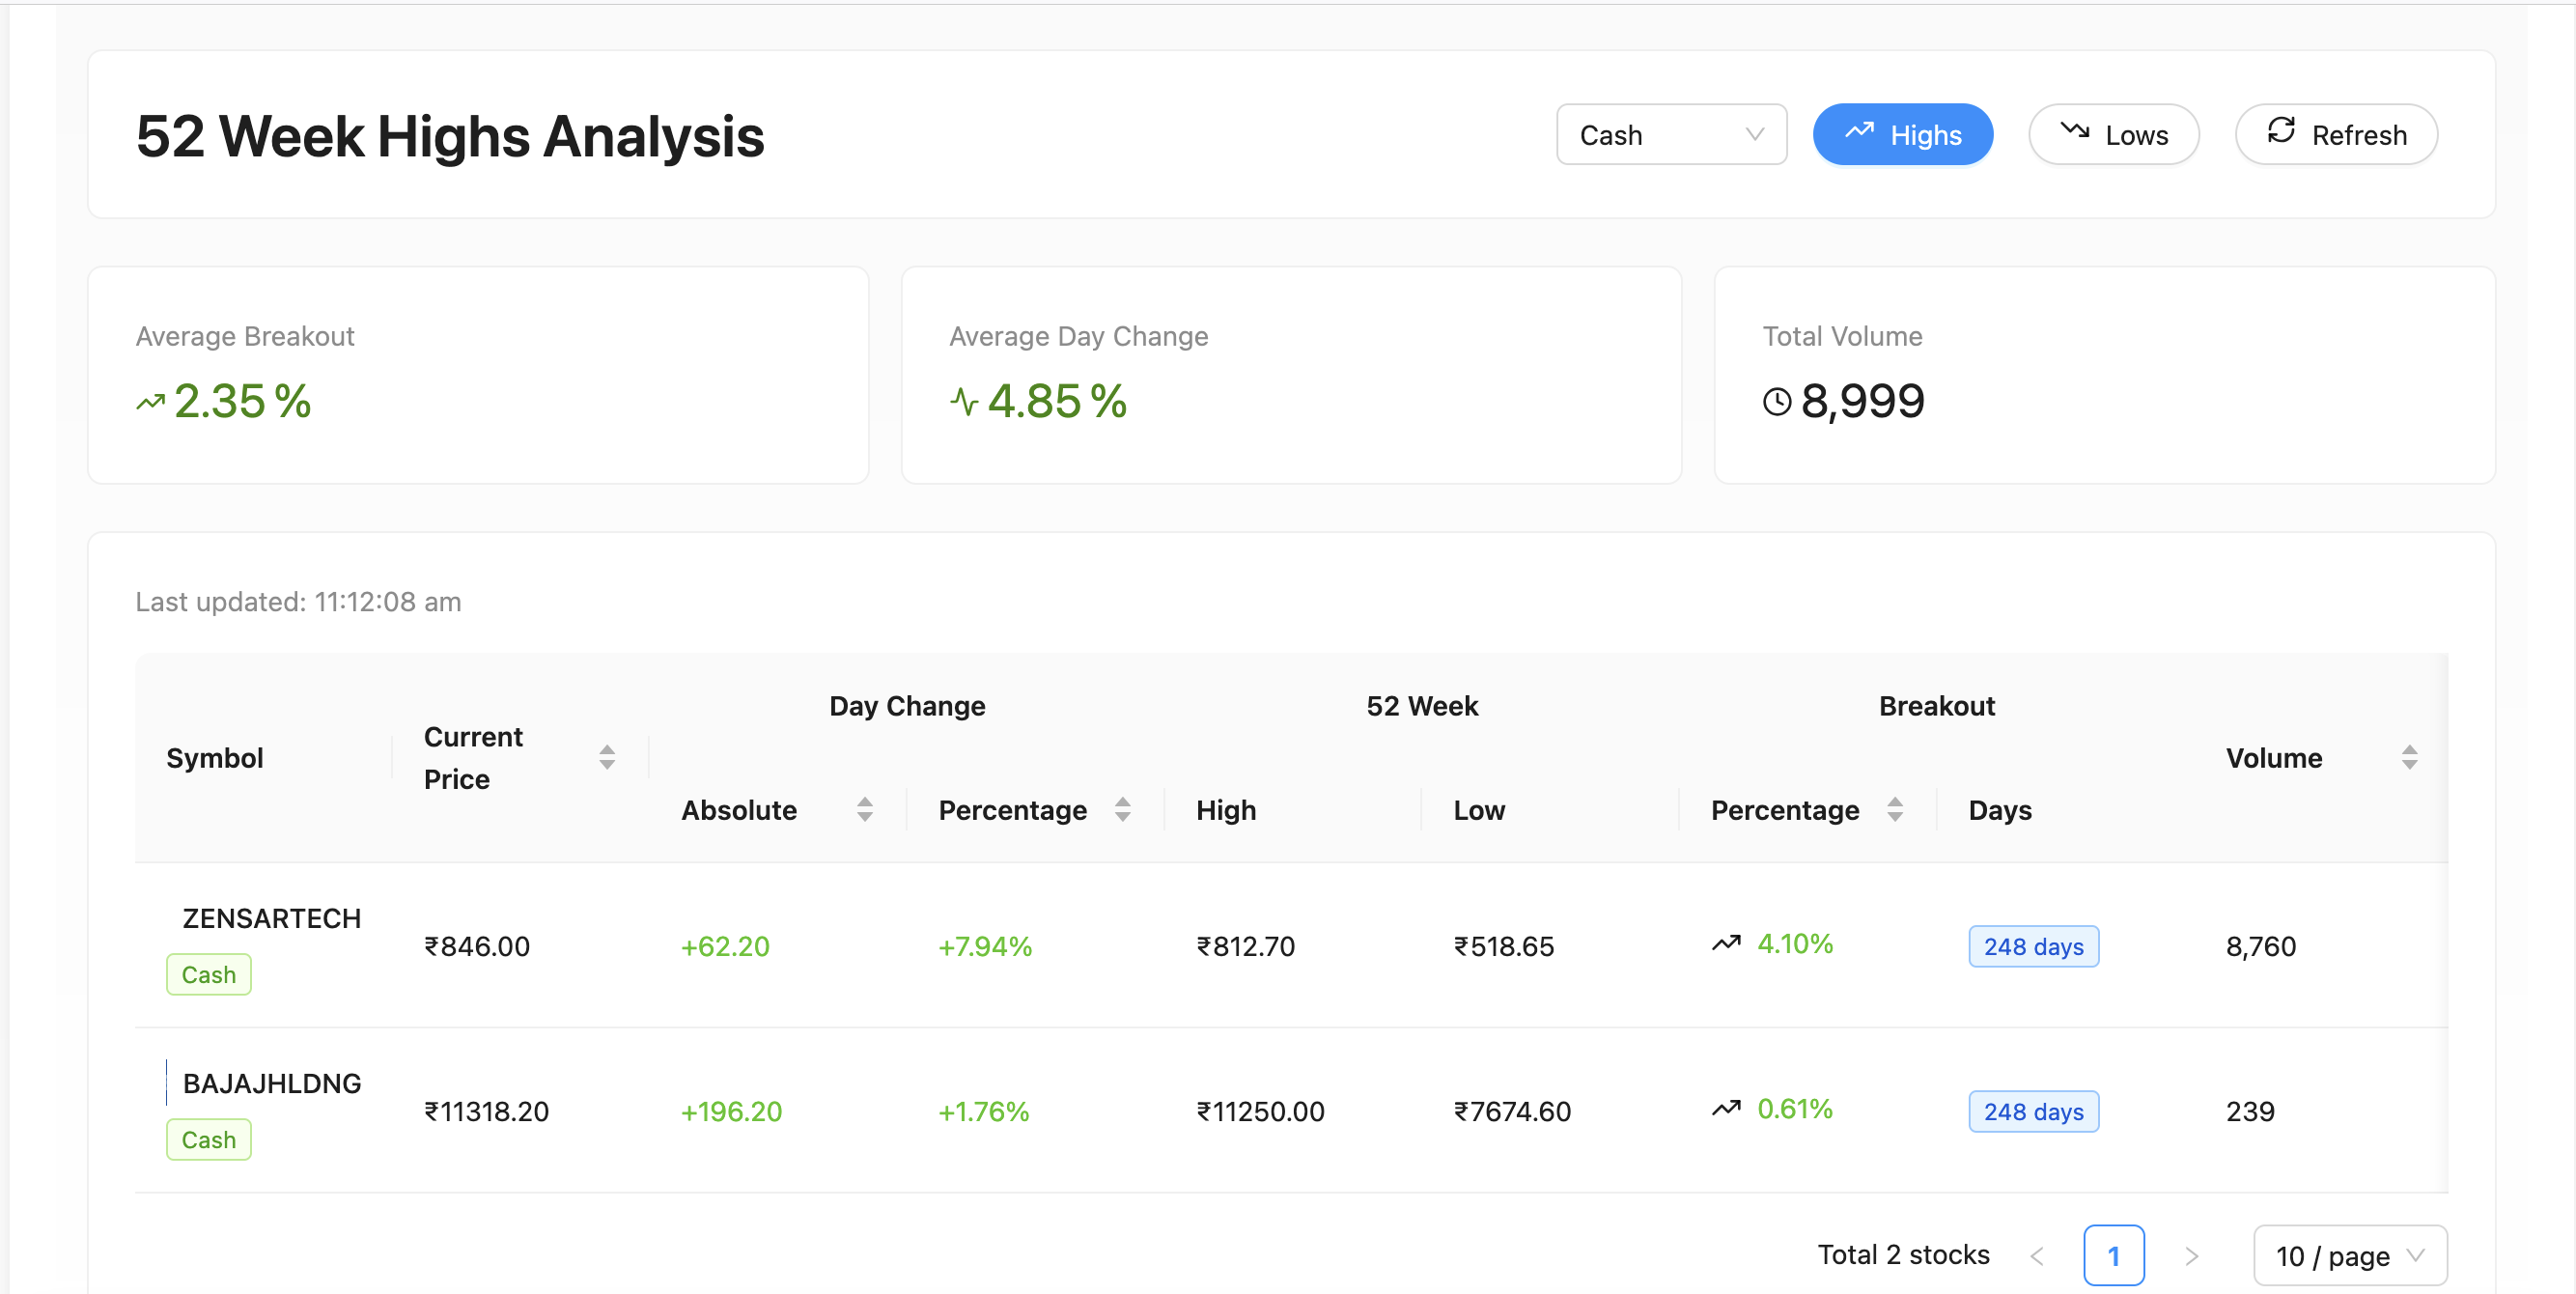
- Choose highs or lows. The buttons switch the reference extreme used by the list.
- Distinguish day change. Day change compares price with the previous close.
- Distinguish breakout distance. Breakout percentage compares price with the selected yearly extreme.
- Read the lookback context. Days describes the available observation history; confirm the reference window.
- Open 52 Week High / Low and choose highs or lows.
- Restrict the universe to the segment you are reviewing.
- Read day change separately from the distance beyond the annual extreme.
- Compare absolute volume and the available history with the chart.
- For a breakout study, review how close price remains to the reference level rather than sorting only by the largest gain.
Treating 52-week lows
A stock at a 52-week low is cheaper than it has been all year, but cheap is not the same as undervalued. Persistent lows often reflect a real problem. Short sellers use lows to find weakness, while value investors look for stocks where the price has fallen more than the business has deteriorated.
- Check why it fell: results, sector trouble, governance or a broad sell-off.
- Wait for a base: a stock that stops making lower lows is a better candidate than one still falling.
- Use the broad market: a sector-wide low differs from a stock-specific one.
A worked example
XYZ has a 52-week high of 520 and consolidates between 505 and 520 for five weeks. It closes at 526, 1.2% above the old high, on 2.2x volume. Stop at 512, back inside the range.
A second stock, ABC, is at 580 after breaking a 520 high weeks ago, 11% above it. Even with the same strength, entering ABC needs a much wider stop, so XYZ is the better-priced setup.
Illustrative numbers for a hypothetical stock, not a recommendation or a past trade.
Review routine
- Scan for the day's new 52-week highs and note the breakout percentage above the prior high.
- Remove illiquid names and those far above the old high.
- Check volume and relative strength to find leaders among them.
- Place the stop back inside the prior range, below the previous high.
- For lows, treat the list as a warning and research list, not a buy list.