
PCR regimes
The put-call ratio (PCR) is put open interest divided by call open interest. It summarises whether positioning leans toward puts or calls.
| PCR | Positioning | Common reading |
|---|---|---|
| Below 0.70 | Call-heavy | Optimism or heavy call writing; can be crowded |
| 0.70 to 1.20 | Balanced | Two-way flow; no strong consensus |
| Above 1.20 | Put-heavy | Hedging demand or put writing as support |
PCR is context, not a signal. High PCR can mean put writers expect support or that buyers are hedging against a fall, and the data cannot tell you which.
Screenshot: controls and readings
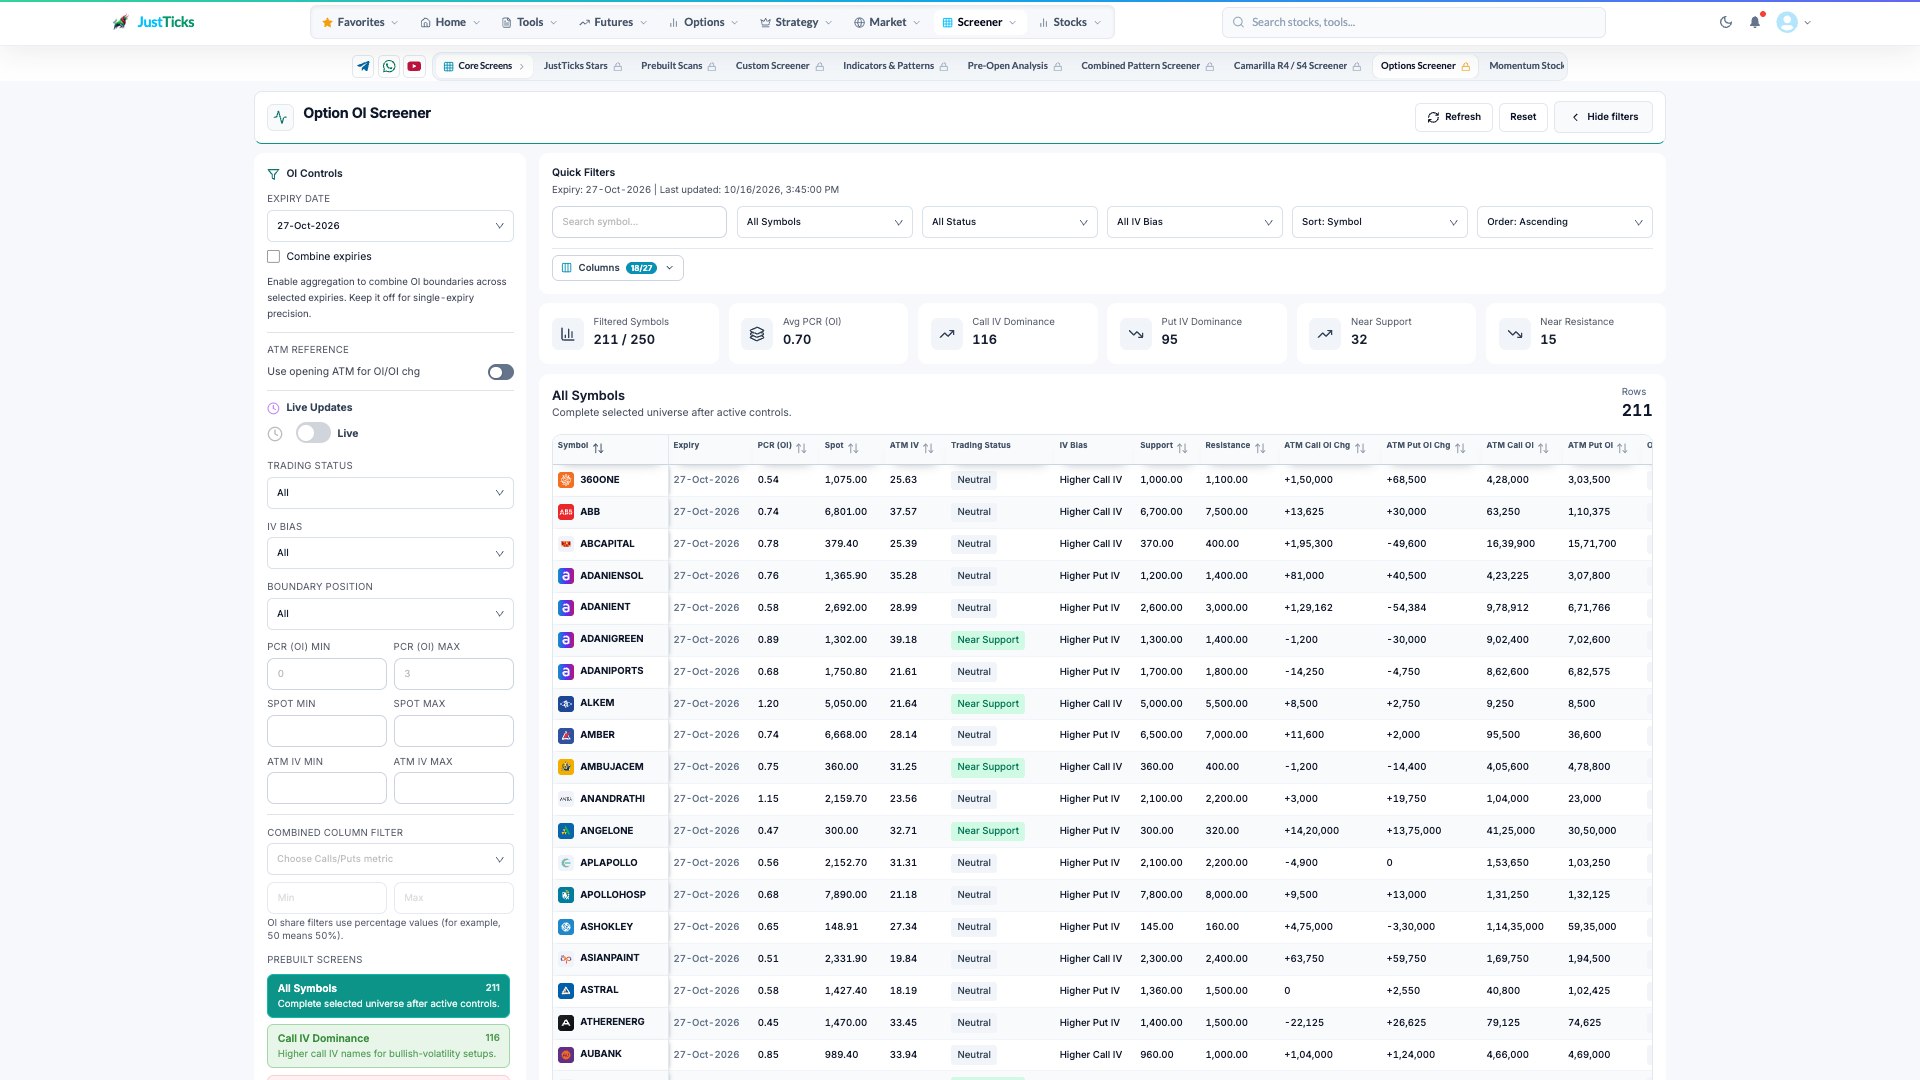
- Expiry. Keep a single expiry for a contract-specific reading; blended expiries have a broader scope.
- OI PCR. Read put OI divided by call OI for the selected scope.
- Trading status and IV. These classifications do not identify the buyers or sellers behind an option position.
- Filter bounds. Use PCR and other numeric filters to narrow a shortlist, then inspect the contract.
How to use the Options Screener
- Open Option Chain Screener, confirm the expiry and available snapshot.
- Choose one prebuilt condition or narrow the PCR and IV context.
- Compare each symbol with its own chain and strike coverage.
- Inspect the reported OI boundaries and price distance rather than inferring support from PCR alone.
- Open Option Chain or the matching stock chain to verify the selected contract data.
IV bias and boundaries
IV bias compares implied volatility on the call side with the put side. Rising put IV suggests demand for downside protection, while rising call IV suggests demand for upside exposure. An extreme PCR with no matching IV shift is often noise; alignment between the two carries more weight.
OI boundaries are the strikes with the largest call OI above spot and put OI below spot, read as potential resistance and support zones. The useful event is price interacting with a boundary: a hold above resistance, or a rejection at support.
Workflow
- Use a prebuilt screen to isolate symbols with a clean IV bias and boundary behaviour.
- Check that the PCR regime agrees with where spot sits relative to support and resistance.
- Confirm on the chart and intraday structure before choosing a direction.
- Check liquidity: wide spreads at the relevant strikes make execution costly.
- Define the trigger and stop before entry, for example a failed reclaim of the boundary.
A worked example
XYZ trades at 2,400. Its PCR is 1.35 (put-heavy), the largest put OI is at 2,300 and rising, and the largest call OI is at 2,500. Spot dips to 2,310 and holds.
PCR regime, OI boundary and price behaviour agree on a support case with a clear stop below 2,300. If 2,300 breaks while put IV rises, the same data flips to a stronger bearish case, which is why the stop is defined before entry.
Illustrative numbers for a hypothetical stock, not a recommendation or a past trade.
Mistakes to avoid
- Treating extreme PCR as a reversal signal without a price trigger.
- Ignoring IV changes after entry. A move in IV can change the risk picture even if price has not moved.
- Trading boundary breaks in illiquid options.
- Averaging down when the boundary reclaim fails; exit instead.