
Defining the opening range
The opening range (OR) is the highest high and lowest low of the first 15 to 30 minutes after the 9:15 open. Many traders use 15 minutes for fast, volatile names and 30 minutes when they want a more stable range. The first minutes absorb overnight news and pre-open orders; by the end of the window the market has shown where buyers and sellers first agreed.
A range that is narrow relative to the stock's average daily range leaves room to run if it breaks; a wide range may already contain most of the day's move.
How to use the ORB Breakout Scanner
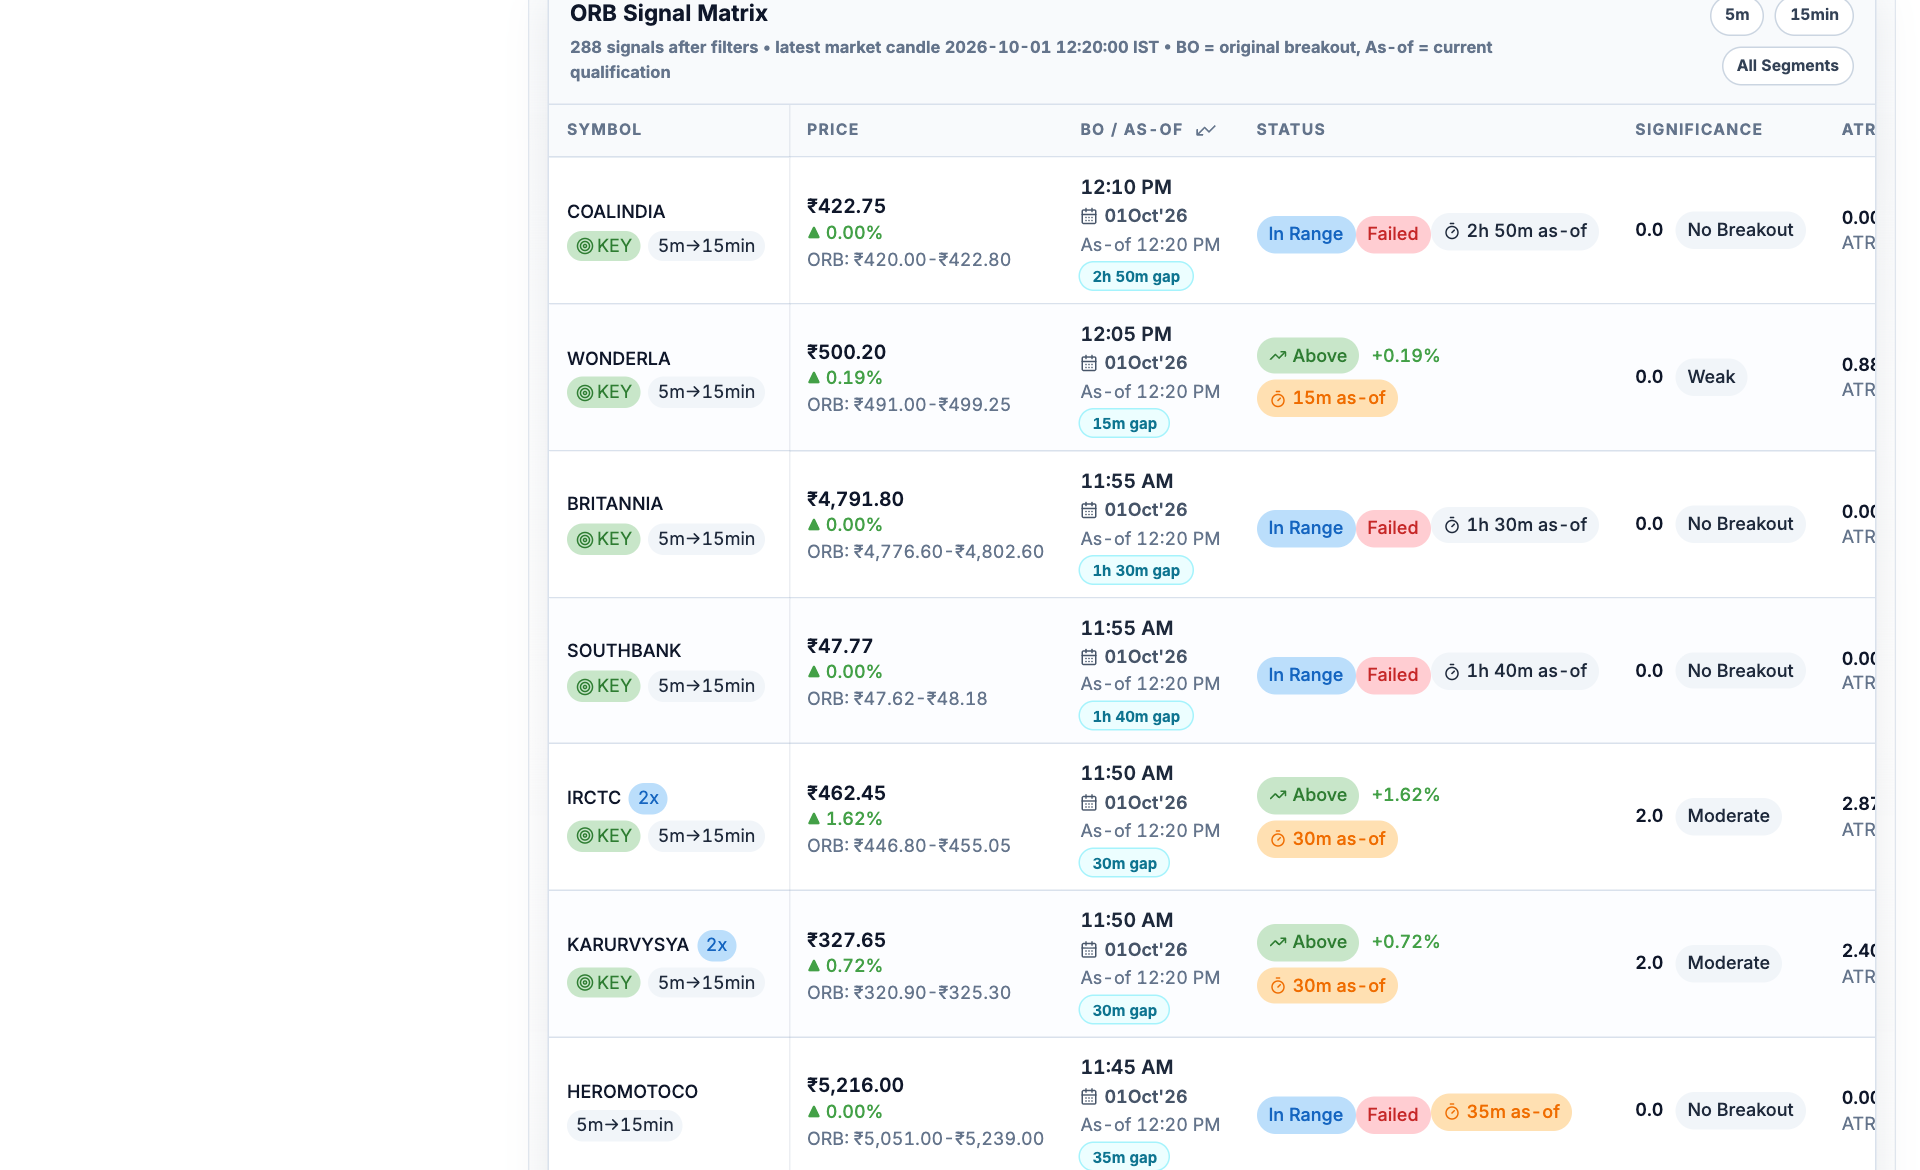
- Read the opening range. The ORB high and low are the fixed range boundaries for that row.
- Separate the two times. BO is the original event; As-of identifies the observation used for current qualification.
- Inspect current status. In Range and Failed show that an earlier break is no longer holding.
- Read significance in context. Significance and ATR context describe the observed setup rather than a guaranteed move.
- Open ORB Breakout, select the session, candle interval and opening-range length.
- Filter the universe and choose whether to review upside, downside or both.
- Read the ORB high/low and compare the original breakout time with the as-of time.
- Separate rows still above/below the range from rows marked failed or back in range.
- Open the chart and compare the current extension with the range width and participation.
Entry, stop and target
| Item | Long (breakout) | Short (breakdown) |
|---|---|---|
| Trigger | Candle closes above the OR high | Candle closes below the OR low |
| Stop | Back inside the range, or the range midpoint | Back inside the range, or the range midpoint |
| Target | 1x to 2x the range height, or a fixed risk multiple | 1x to 2x the range height, or a fixed risk multiple |
Using the range midpoint for the stop halves the risk but increases whipsaw exits. Choose one rule and test it on past sessions before trading it.
Filters that reduce false breaks
- Trade with the day's bias. Check the gap, the index direction and where price sits relative to VWAP.
- Require volume on the breakout candle above the opening candles' average.
- Skip stocks at major resistance just above the OR high.
- Limit attempts. The first break often fails; avoid re-entering the same side repeatedly.
- Avoid event days such as results or policy announcements unless you have a specific plan.
A worked example
XYZ's 15-minute opening range is 1,200 to 1,214, a height of 14. At 9:45 a candle closes above 1,214. Entry 1,215, stop at the range midpoint 1,207 (risk 8), target one range height above the high at 1,229 (reward 14).
That is 1.75R (14 ÷ 8). With the stop at the range low of 1,200 the risk is 15 and the same target pays less than 1R. A wider stop survives more noise but needs a larger target to be worth taking.
Illustrative numbers for a hypothetical stock, not a recommendation or a past trade.
When ORB fails
On range-bound days price breaks one side, reverses and breaks the other, stopping out both. The strategy works best on trend days and underperforms on flat, low-volatility sessions. Because there is no way to know in advance which day it is, the edge comes from small losses on the failures and keeping the winners, not from a high hit rate.