
The signals that measure momentum
| Signal | What it measures | Strong reading |
|---|---|---|
| RSI | Speed of recent gains versus losses | Sustained above 50; above 70 is very strong but can be stretched |
| ADX | Strength of a trend, regardless of direction | Above roughly 20 to 25 shows a trend is present |
| VWAP | Price relative to the day's volume-weighted average | Price holding above VWAP |
| Supertrend | Trend direction with a volatility-based trailing line | Price above a rising line |
| Relative volume | Participation versus normal | Above average on the move |
No single signal is enough. RSI can stay high in a strong trend, and ADX only shows that a trend exists, not its direction. Agreement across several is what makes a ranking useful.
How to use the Momentum Stocks Screener
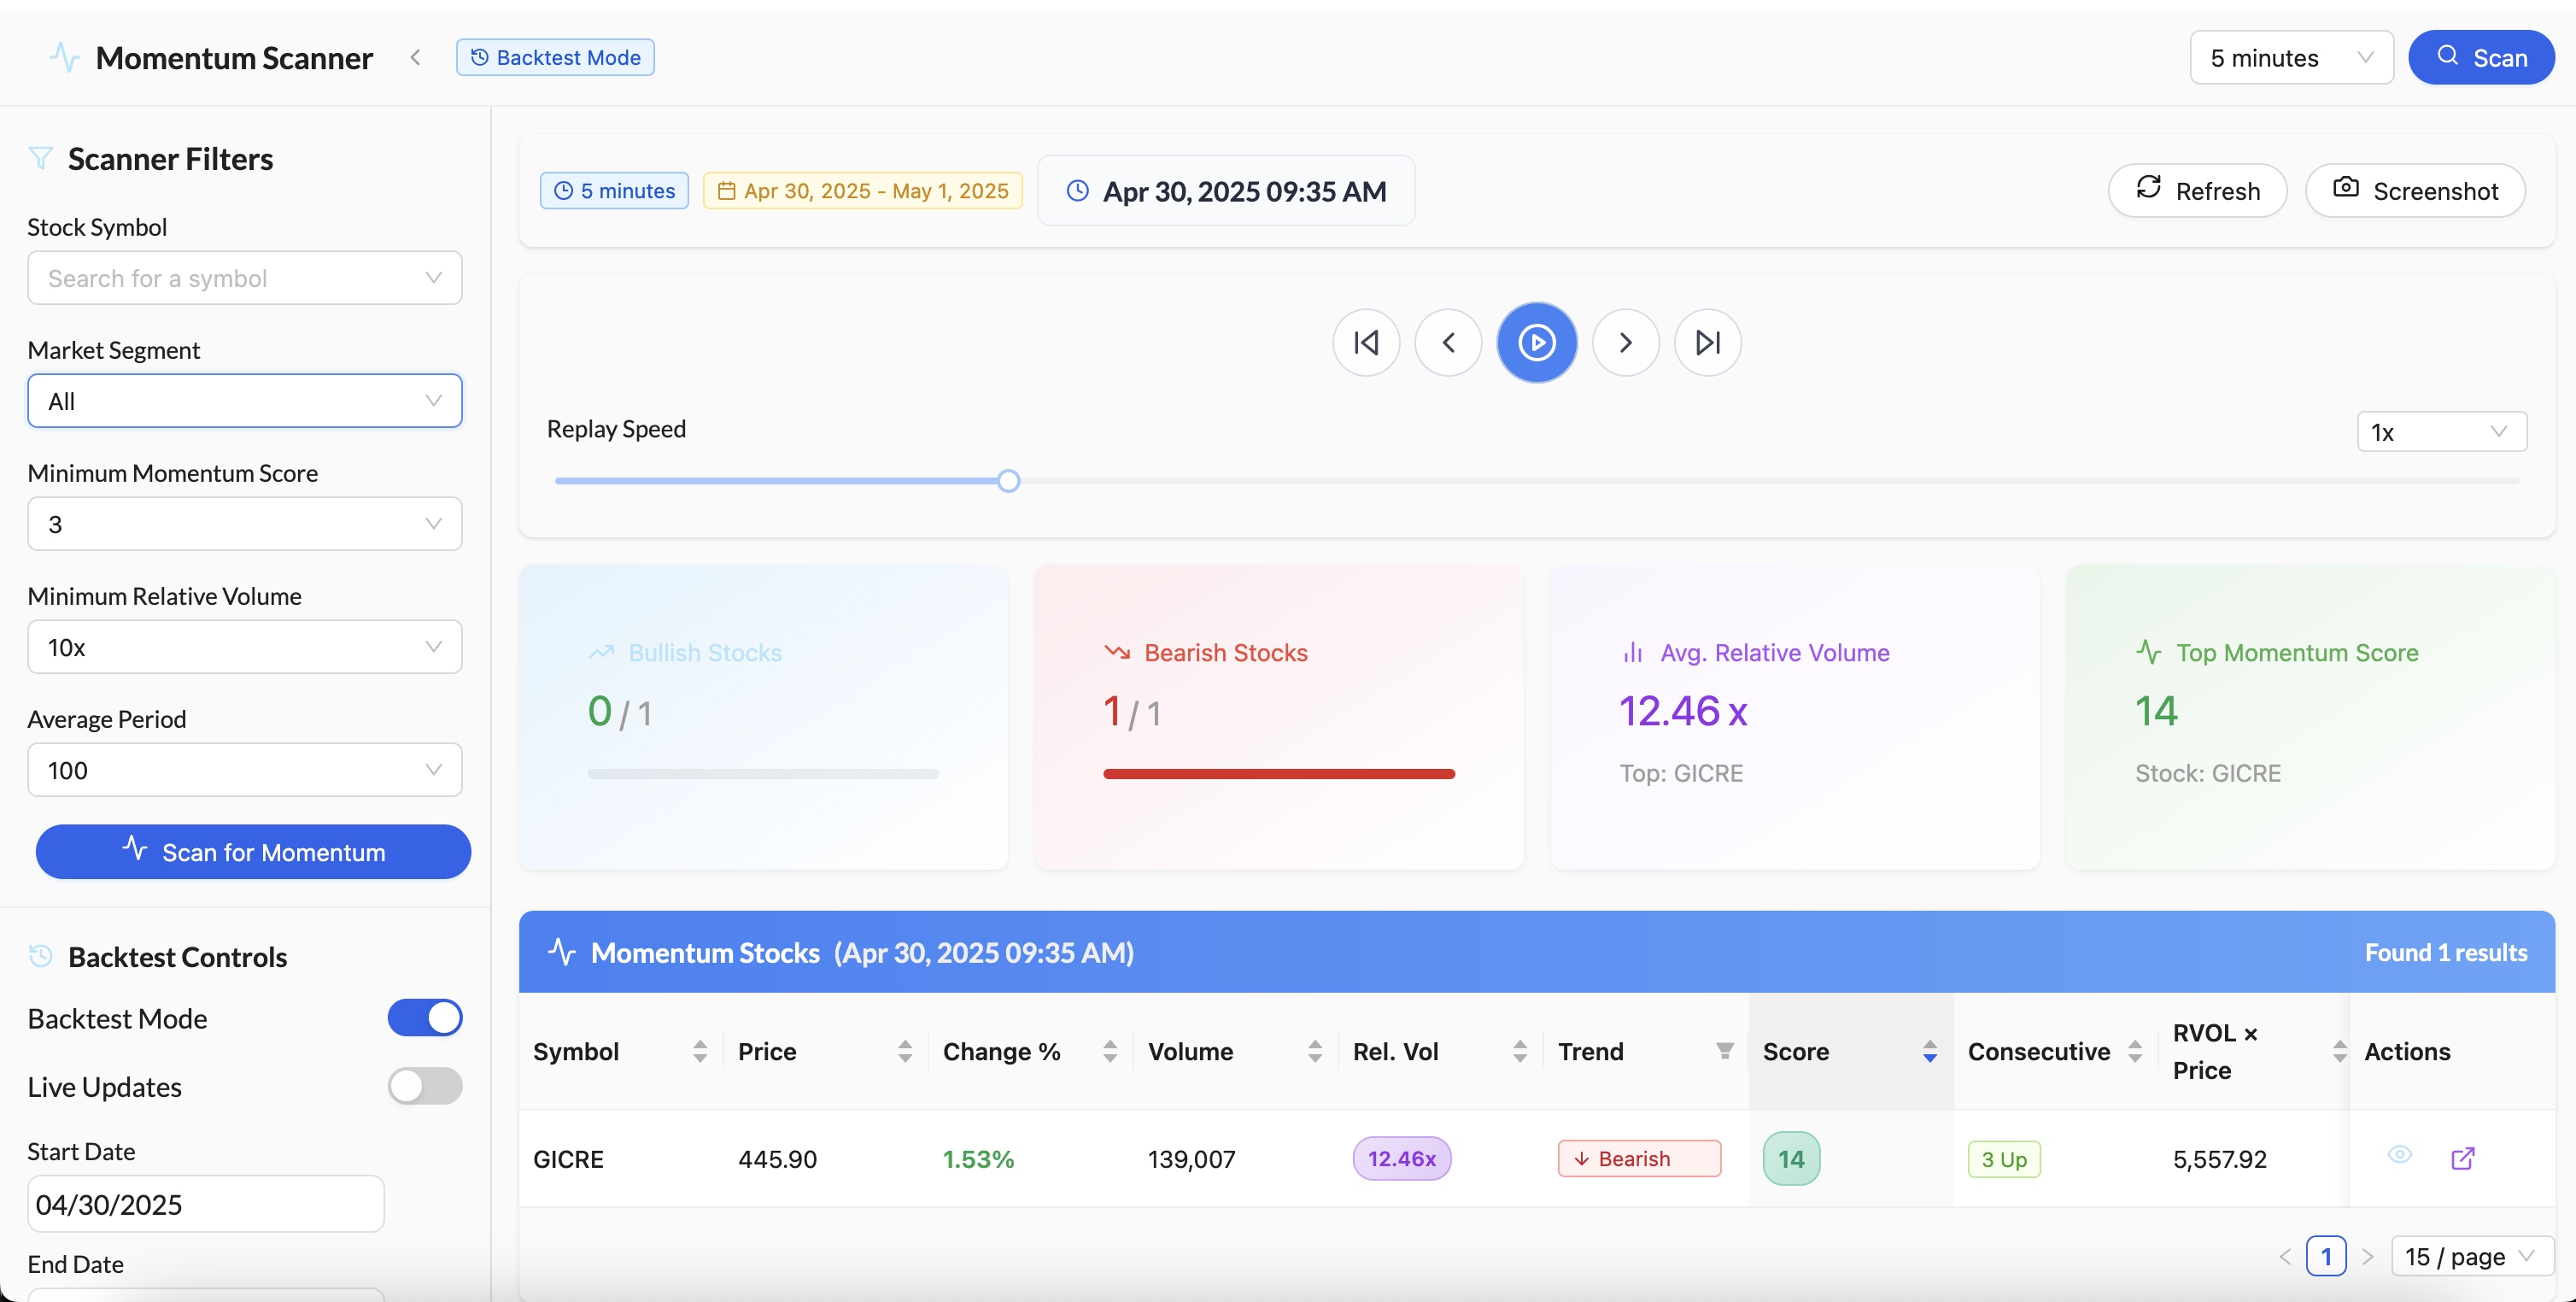
- Filter score and participation. Momentum score and minimum relative volume are separate constraints.
- Replay a fixed session. Playback steps through historical snapshots instead of placing trades.
- Separate breadth and intensity. One high relative-volume symbol does not imply broad market participation.
- Read every column. The row can contain a positive price change and a different model trend label; check the observation window.
- Open Momentum Stocks and choose the timeframe and segment.
- Set a minimum score, relative volume and averaging period.
- Read the time of the candidate row, not just the browser fetch time.
- Compare trend, consecutive bars and participation with the price chart.
- Use historical playback to observe how a candidate enters and leaves the list; replay does not include fills or trading costs.
Why alignment beats any single indicator
A stock where price is above VWAP, the Supertrend is bullish, ADX shows a real trend and volume is expanding has several different kinds of evidence agreeing. A composite score combines these so the most aligned names rise to the top. It describes agreement, not a forecast.
Avoiding exhausted moves
- Distance from the average. A stock far above its moving average has little cushion if it turns.
- Parabolic candles. A single huge bar with a long upper wick often marks a short-term top.
- Divergence. Price makes a new high while RSI or volume does not.
- Breadth. If only a handful of stocks are strong while the index weakens, momentum is narrow and fragile.
A worked example
Two stocks on the same scan day:
| Signal | Stock A | Stock B |
|---|---|---|
| Price vs VWAP | Above | Above |
| Supertrend | Bullish | Bullish |
| ADX | 28, trending | 18, weak trend |
| Relative volume | 2.1x | 0.9x |
| Distance from 20-day average | 3% above | 14% above |
| Read | Aligned, room left | Stretched without participation |
Stock A has several different kinds of evidence agreeing. Stock B is strong on price alone and is the kind of name that tends to snap back.
Worked example
Illustrative numbers for a hypothetical stock, not a recommendation or a past trade.
Trading momentum with a plan
- Match the timeframe to your horizon: intraday scans for same-day trades, daily for swing trades.
- Prefer pullbacks within the trend over chasing the latest candle.
- Use a volatility-based stop such as a multiple of ATR so the stop reflects the stock's normal movement.
- Reduce size when the market breadth is poor.
- Exit when the signals that qualified the stock stop agreeing.