
The retracement levels
After a strong move, price often pulls back part of the way before continuing. Fibonacci retracements measure that pullback as a percentage of the move, between the swing's start (100%) and its end (0%).
| Level | Pullback depth | How traders treat it |
|---|---|---|
| 23.6% | Shallow | Strong trend; price barely pauses |
| 38.2% | Moderate | Primary decision zone in healthy trends |
| 50% | Half | Common reaction level, not a Fibonacci ratio |
| 61.8% | Deep (golden) | Primary decision zone; deeper than this weakens the trend |
| 78.6% | Very deep | Last line before the structure fails |
Screenshot: controls and readings
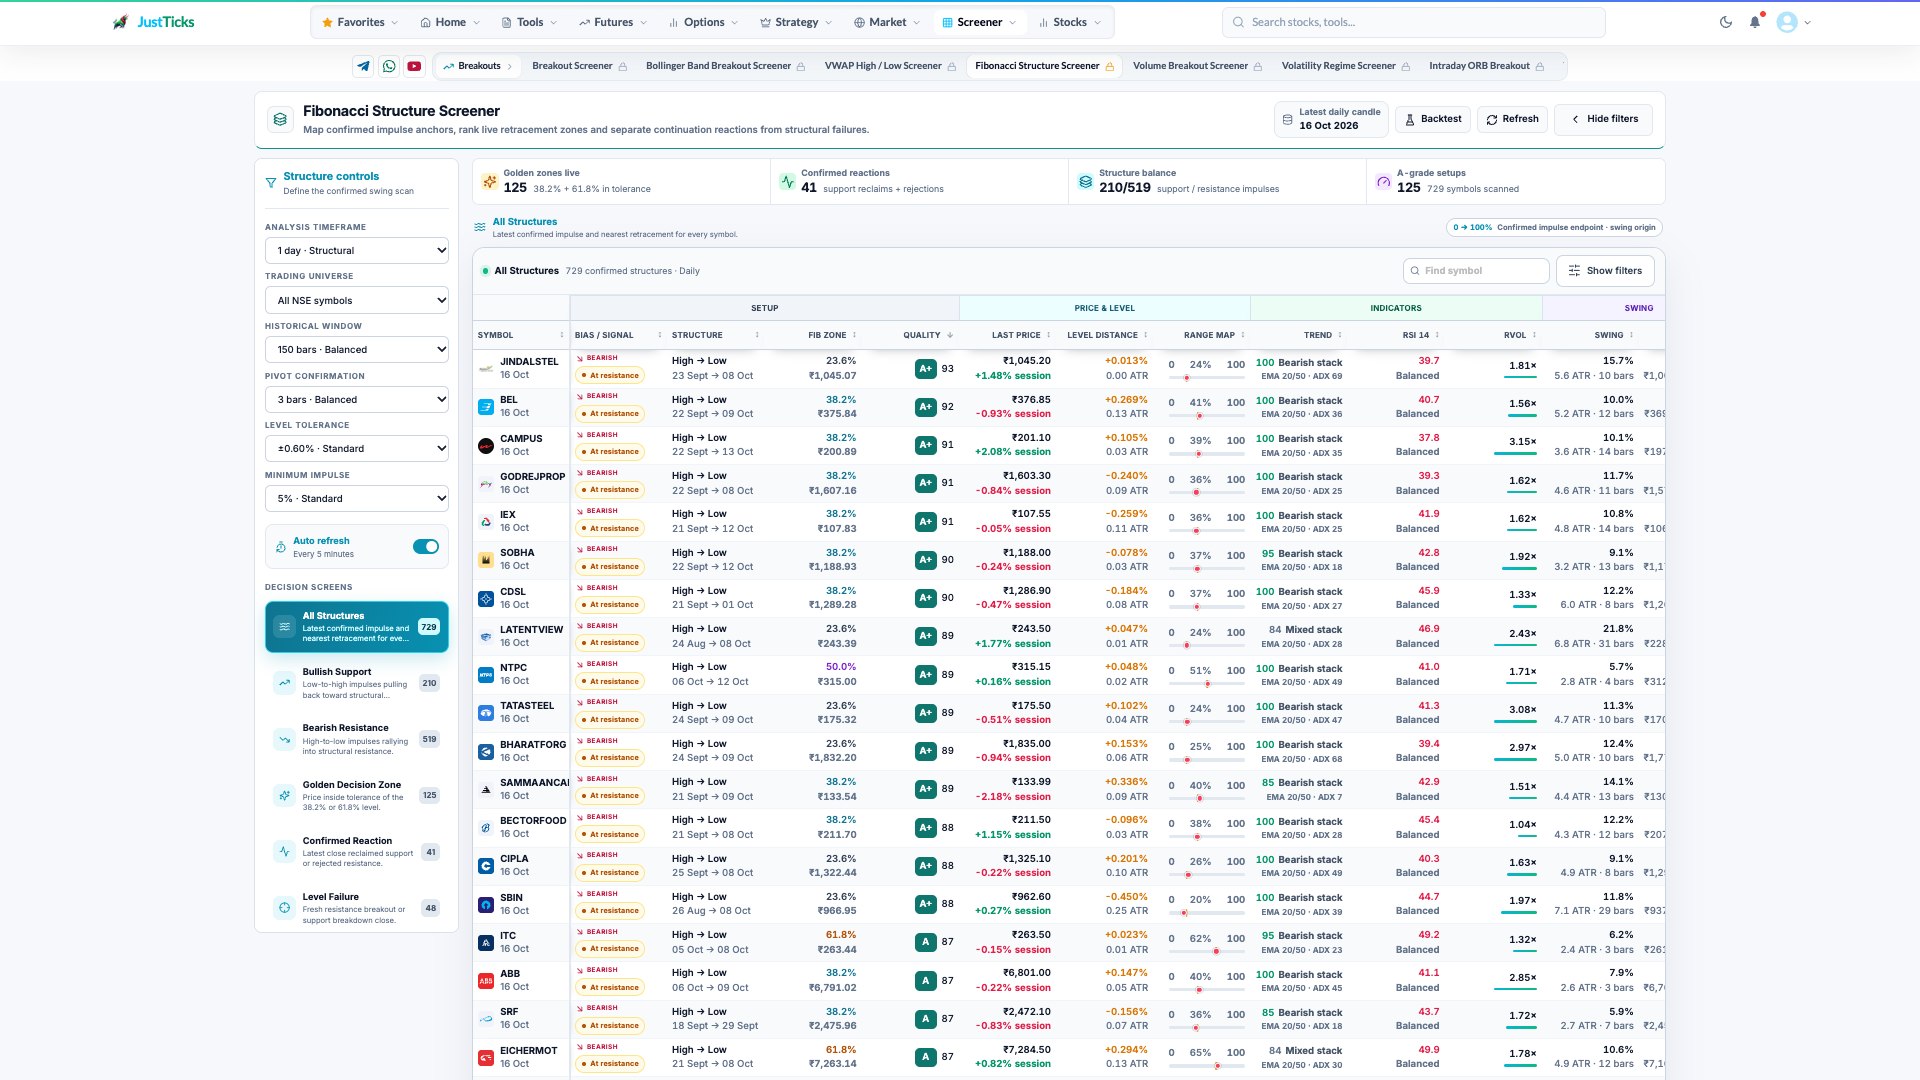
- Historical window. This defines the available swing search, rather than a forecast horizon.
- Pivot confirmation. Confirmed swing anchors may appear later than a visually obvious turning point.
- Fib zone. Check the actual anchor direction and quoted level behind the percentage.
- Distance and range. The level gap and range map show where price sits relative to the selected impulse.
How to use the Fibonacci Structure Screener
- Open Fibonacci Structure Screener, select timeframe and session.
- Choose bullish support or bearish resistance according to the detected impulse direction.
- Inspect the confirmed swing anchors and exact price of the nearest retracement.
- Separate a price near a level from a confirmed reaction or a level failure.
- Compare distance to the level, ATR context and participation. Changing anchors changes every retracement.
Anchors decide everything
Every level depends on the two swing points you pick. A retracement drawn from arbitrary points is arbitrary. Use confirmed pivots: a swing high or low is confirmed only after a set number of completed candles on both sides fail to exceed it. The latest, unfinished extreme should never be an anchor because it can still move.
Also require a minimum swing size relative to the stock's volatility. A tiny swing produces levels so close together that every price touches one.
Reading a reaction
| State | Meaning |
|---|---|
| Near | Price is within a tolerance zone of a level; nothing confirmed yet |
| Bounce | Price reclaims support at the level after testing it |
| Rejection | Price fails at resistance and closes back below it |
| Breakout or breakdown | A close beyond the level, suggesting the structure is failing |
A level that price merely touches is not a signal. Wait for the candle that shows the reaction.
A worked example
XYZ rises from a confirmed low of 200 to a confirmed high of 260, a range of 60. The levels are: 23.6% at 245.8, 38.2% at 237.1, 50% at 230.0 and 61.8% at 222.9.
Price pulls back to 238 and a candle closes back above the 38.2% level. Entry 239, stop below the 50% level at 229.5 (risk 9.5). The first objective, 245.8, pays only 6.8, or 0.7R; the larger target at 260 pays 21, or 2.2R. The trade only works if the move continues to the impulse high, which is the point to plan around before entry.
Illustrative numbers for a hypothetical stock, not a recommendation or a past trade.
Targets and invalidation
- First objective: the next shallower retracement level.
- Larger target: the original impulse endpoint.
- Invalidation: the next deeper level, or a close beyond the level you traded from.
- Quality filters: trend agreement (moving averages, momentum) and volume on the reaction candle make a level more reliable.
Fibonacci levels are zones where traders look for reactions, not lines price must respect. Many levels cluster, so confirm with a candle and with other structure before acting.