
What confluence means
Confluence is the agreement of separate pieces of evidence at the same place and time. In pattern work it usually means several pattern types, or a pattern plus a level or volume condition, pointing the same way on one stock.
Grouping detections by symbol and timestamp lets you see this agreement in one place instead of across several scanners.
How to use the Combined Pattern Screener
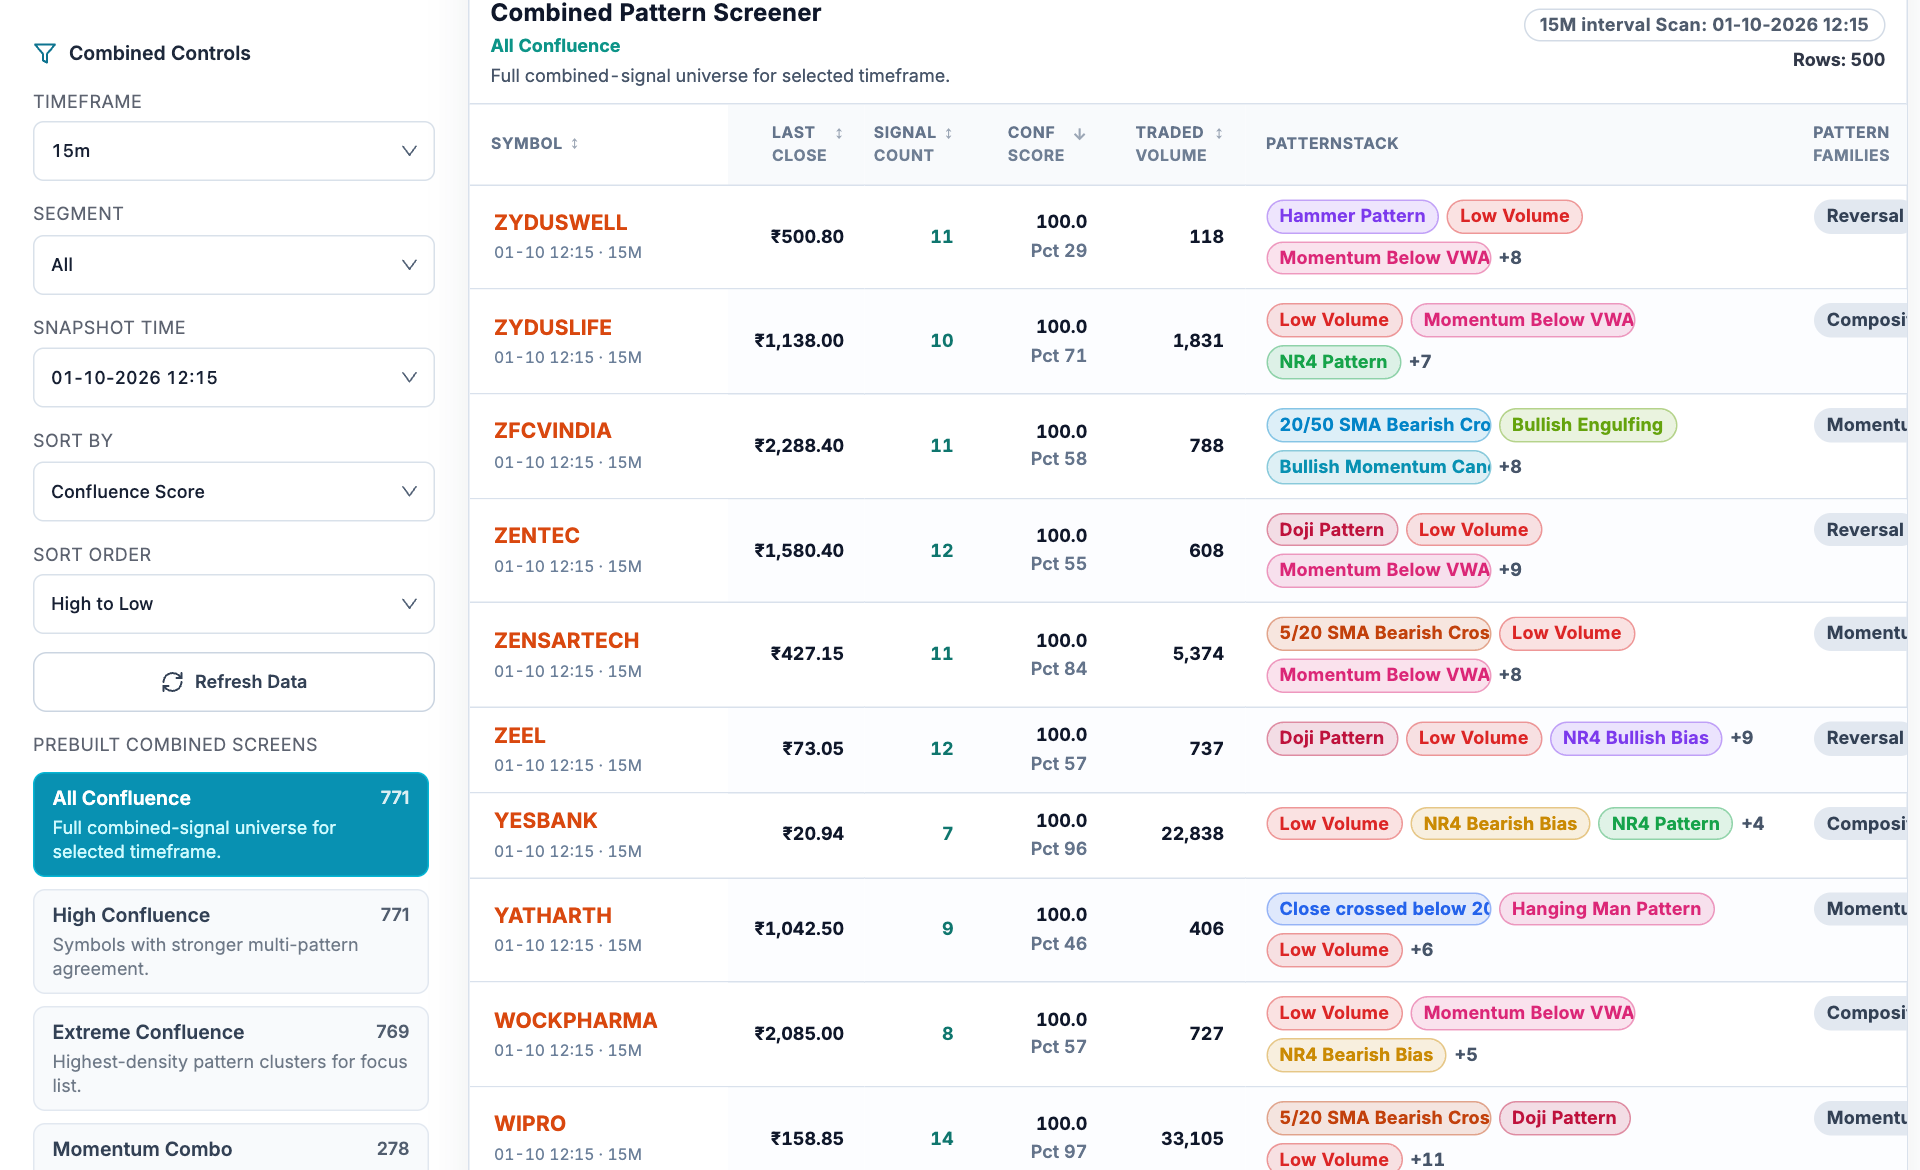
- Match the timeframe. A 15-minute pattern stack must be compared with the same snapshot interval.
- Keep one snapshot. The selected time is the common observation for the combined list.
- Interpret the ranking. A confluence score is a ranking measure; a value of 100 is not a success probability.
- Read the pattern stack. Mixed or opposing labels can coexist, so inspect the components behind the score.
- Open Combined Pattern Screener, select the timeframe, segment and snapshot.
- Choose a prebuilt confluence group or start with All Confluence.
- Sort by signal count, score or participation to answer a specific question.
- Expand or read the pattern stack; several correlated signals may describe the same underlying price event.
- Inspect the symbol chart and confirm whether the stack agrees on direction before drawing a conclusion.
Overlap is not independence
Two patterns drawn from the same candles are largely the same observation seen twice. A bull flag and an ascending channel on one set of swings do not give twice the evidence. Real confluence comes from different sources: a pattern boundary that also matches a prior swing high, a breakout that is also backed by volume, or a pattern on the daily chart that aligns with the hourly.
| Combination | Independent? | Why |
|---|---|---|
| Flag + channel on the same swings | No | Same candles, different drawings |
| Pattern breakout + volume expansion | Yes | Price and participation are separate data |
| Pattern boundary at a prior swing high | Yes | Level comes from earlier history |
| Daily pattern + hourly trigger | Mostly | Different timeframes, related candles |
A worked example
XYZ shows a bull flag and an ascending channel, both drawn from the same swings: count them as one observation. The flag's top at 640 equals a prior swing high at 640, and the breakout closes at 644 on 2x volume.
Independent evidence here is the level (earlier history) and the volume (participation). The second pattern name added nothing. That is the test: would the second piece of evidence exist if the first one did not?
Illustrative numbers for a hypothetical stock, not a recommendation or a past trade.
Reading a detection
- Trigger: the price that completes the pattern. Until price closes beyond it, the pattern is still forming.
- Boundaries: the lines that define the structure. A close back inside them invalidates the setup.
- Direction: where bullish and bearish detections overlap on one stock, treat the signal as unresolved.
- Projected target: a geometric measurement, such as the height of the pattern added to the breakout point. It is a reference, not an expected return.