
Use the GEX chart: scope, strike profile and history
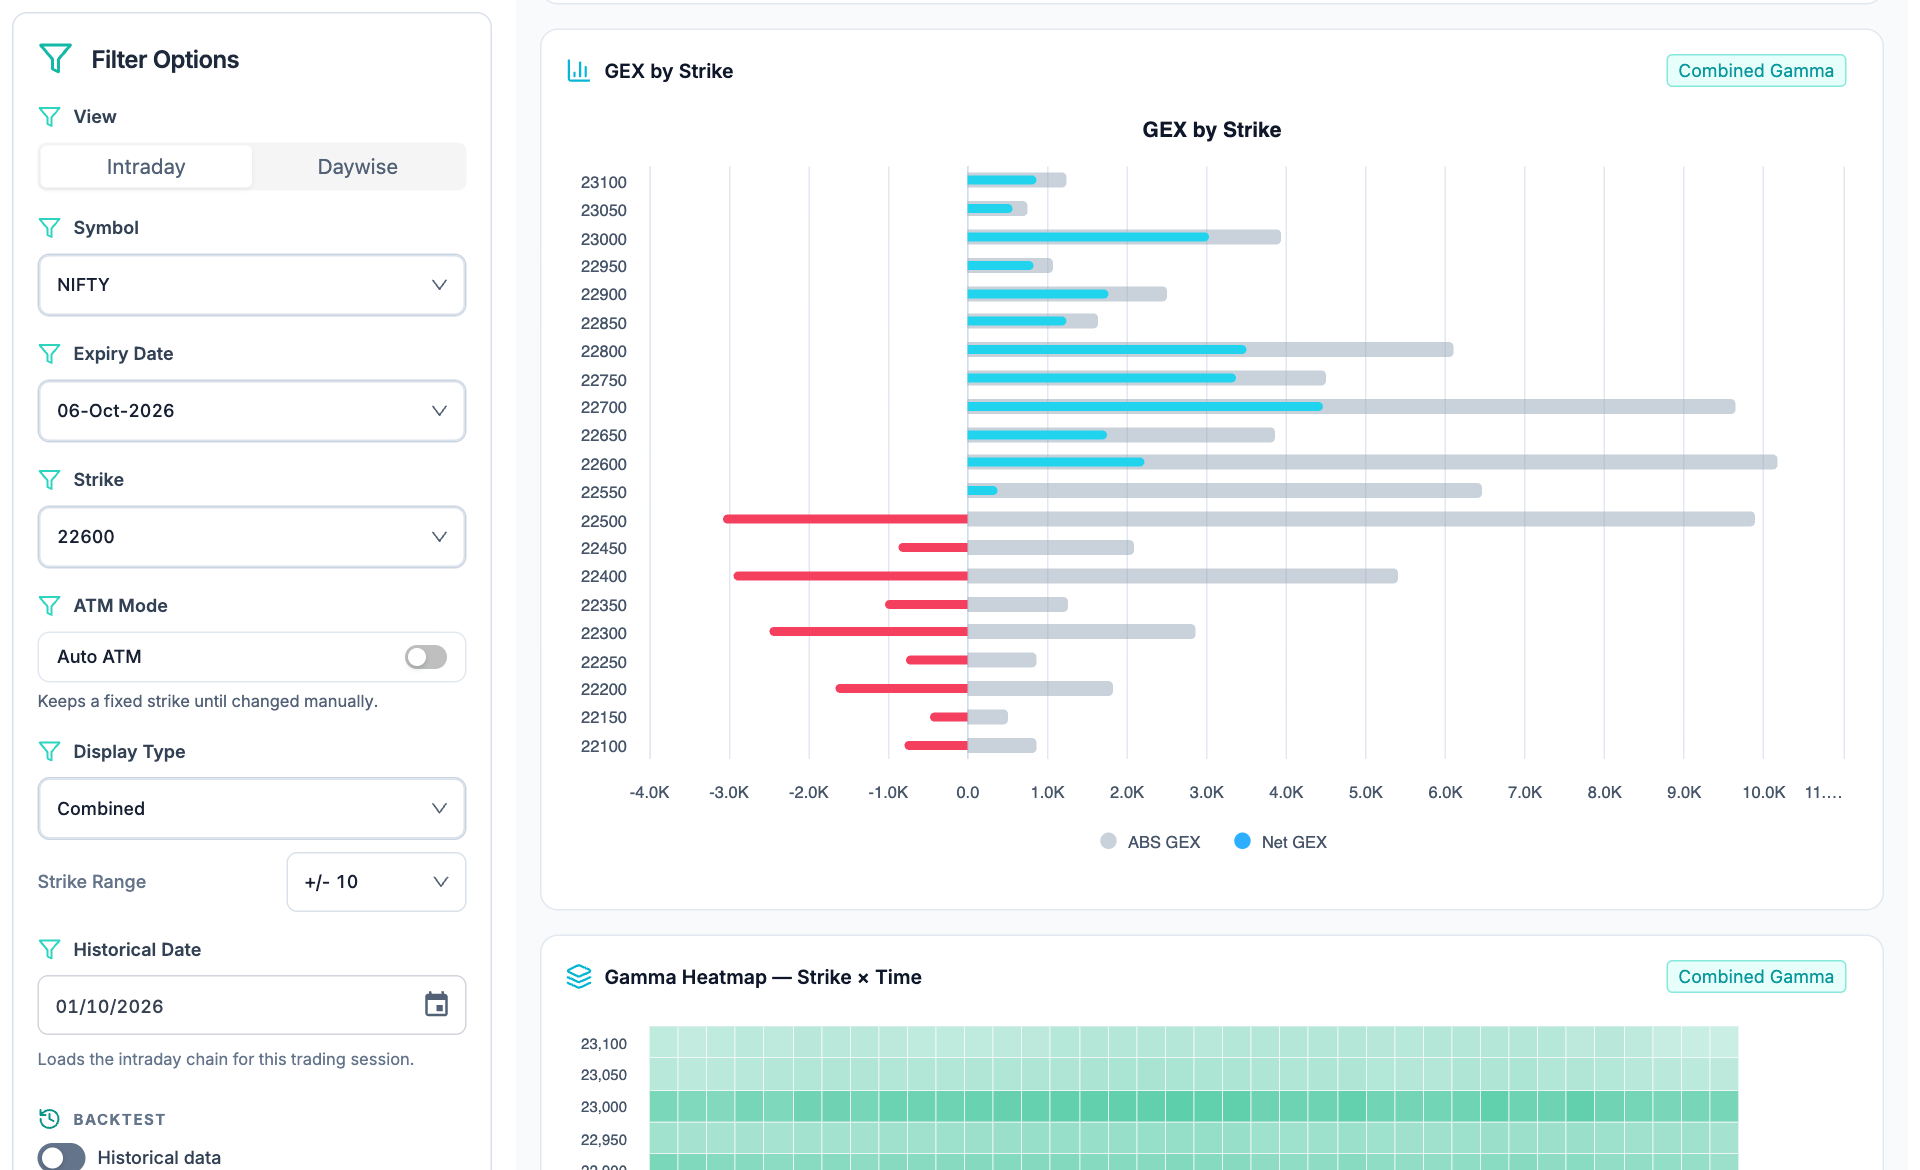
- Intraday or daywise. Choose the time view before comparing snapshots. A single intraday profile and a daily history summarize different observations.
- Expiry and strike scope. Fix the instrument, expiry and strike coverage. Auto ATM can change the reference strike as spot moves.
- Signed versus absolute exposure. The legend separates net GEX from absolute magnitude. Offset exposures can make net small while gross concentration remains large.
- Strike-by-time history. Use the supporting heatmap to check whether the concentration persists, fades or moves to other strikes.
- Select the underlying, expiry, session and strike window. Check the observation time and the units shown by the tool.
- Read net exposure and the modeled regime, then inspect the distribution rather than relying only on its total.
- Compare call and put walls with the actual zero-gamma sweep. Read the exposure sign on each side of the crossing; the orientation is not universal.
- Use the heatmap or daywise history to inspect persistence. Open the GEX Screener to compare instruments after understanding one profile.
What is gamma exposure (GEX)?
Every option has gamma: the rate at which its delta changes as the underlying moves. Adding up the gamma of all open contracts, weighted by open interest, gives a strike-by-strike map of how much hedging activity a price move could trigger. That map is gamma exposure. Option sellers who hedge their books must buy or sell the underlying as delta shifts, and where that hedging is heavy it can either dampen price movement or feed it.
For index options such as Nifty and BankNifty, exposure is usually expressed in rupees of hedging notional per 1% move so that strikes and days can be compared. Because NSE publishes open interest but not who holds each contract, GEX is an estimate: it depends on a positioning convention, the selected expiry and the model inputs. It is best read as a risk map, not as a record of what any participant actually holds.
In one line: GEX tells you what kind of market you are probably in (stabilizing or destabilizing) and where hedging pressure may be concentrated. It does not tell you which way price will go.
Why GEX matters for Nifty and BankNifty
Indian index options are among the most actively traded in the world, and short-dated expiries concentrate gamma into the current session. Near expiry, at-the-money gamma is large, so a small index move can shift delta sharply and hedging becomes a bigger share of intraday flow. That is why walls, the flip level and the peak gamma strike are watched most closely on expiry day. Check NSE for the current weekly expiry schedule, because expiry days and contract specifications have changed over time.
GEX complements, rather than replaces, the tools most Indian traders already use. Open interest and max pain describe positioning and where option writers benefit most at expiry; GEX describes how hedging may react as spot moves.
The four levels to read on a GEX chart
Net GEX and regime
Sign and sizeThe sum of call exposure and put exposure across the selected expiry. A positive value points to a stabilizing, mean-reverting regime; a negative value points to a destabilizing one where ranges can expand. Near zero, treat the regime as uncertain.
Gamma flip (zero gamma)
Regime boundaryThe estimated spot level where net GEX crosses zero. It marks where modeled hedging can change from damping moves to amplifying them, or the reverse. It is a state change, not a trade signal, and it moves through the session.
Call Wall
Upside concentrationThe strike with the largest call-side exposure. It is commonly treated as a potential resistance or pinning zone, especially near expiry. A wall that migrates or loses concentration is less dependable than one that persists.
Put Wall
Downside concentrationThe strike with the largest put-side exposure. It is commonly treated as a potential support zone. Acceptance beyond the put wall is a meaningful change in structure, not a guaranteed floor breaking.
On the live Nifty gamma exposure chart, net GEX is drawn as bars by strike (negative below zero, positive above), a curve traces absolute GEX to show where total gamma concentrates, and vertical markers show spot, the gamma flip, the call wall, the put wall and the peak strike. Peak gamma is the strike with the largest overall concentration and, in crowded expiry conditions, it can behave like a price magnet.
Positive vs negative gamma: the regimes
| Regime | Modeled hedging | Behavior to watch |
|---|---|---|
| Positive net GEX, spot above the flip | Leans against moves: sells strength, buys weakness | Range-bound trade, pinning between walls, lower realized volatility |
| Near zero, close to the flip | Unstable: a small move can change the regime | Whipsaw risk; treat wall levels with lower confidence |
| Negative net GEX, spot below the flip | Follows price: buys strength, sells weakness | Range expansion; accepted breaks are more likely to extend |
| Expiry day | Gamma concentrates in near-the-money strikes and shifts quickly | Walls and the flip can migrate intraday; recheck the timestamp |
The sign describes the character of movement, not its direction. A negative-gamma day can still grind higher; it simply tends to do so with wider swings and stronger continuation after accepted breaks.
How to read the chart: a five-step routine
- Start with the regime. Is net GEX positive, negative or near zero for the selected expiry?
- Mark the corridor. Compare spot with the put wall below and the call wall above. Price inside the corridor can behave differently from price accepted beyond a wall.
- Measure the distance to the flip. The closer spot is to the gamma flip, the easier it is for a small move to change the regime, which raises whipsaw risk.
- Check persistence. Look at the intraday heatmap or the daywise history rather than a single frame. Walls that migrate or fade are less dependable than levels that persist.
- Confirm before acting. Validate any setup with price acceptance, volume, liquidity and scheduled event risk. GEX alone is never an entry.
Using GEX on expiry day
Expiry-day gamma is the most concentrated of the week, so the same chart needs more care. Read the map after the open rather than trusting the previous session's levels, because the opening option-chain update can move walls. Compare peak gamma, the walls and max pain, but keep the concepts separate: confluence can raise pinning risk, and it does not guarantee a settlement price. As expiry passes, hedging pressure tied to that expiry disappears, so a level that mattered in the morning may carry little weight later.
Limitations and common misreads
- Positioning is assumed. Exchanges do not publish who is long or short each option. The usual convention treats calls and puts asymmetrically; if real positioning were reversed, the profile would invert. This matters in India, where retail participation in options is heavy.
- Dashboards disagree. Open-interest units, expiry scope and model inputs all change absolute values. The regime, the walls and the flip level compare most fairly across sources; raw magnitudes do not.
- Levels are not barriers. Walls are potential support and resistance zones. Event days such as RBI decisions, the Union Budget or earnings can overwhelm modeled hedging structure.
- Stocks are noisier. Sparse strikes, wide spreads or concentrated open interest lower the reliability of stock-level profiles.
- The exact model is proprietary. JustTicks documents its inputs, sign convention and units on the tool page rather than publishing its full implementation.
GEX vs max pain vs open interest: which to use
| Tool | Answers | Best used for |
|---|---|---|
| GEX | How might hedging react as spot moves? | Regime, wall corridor, volatility expectations |
| Max pain | Where do option writers collectively benefit most at expiry? | Settlement-focused context |
| Open interest | Where is positioning building or unwinding? | Support and resistance zones, buildup reads |
They answer different questions and can agree or disagree at any moment. Use them together, and treat agreement between them as a reason for a closer look, not as confirmation on its own.